Treasury yields moved sharply higher through August and September, extending July's selloff and pushing long-term rates to levels not seen in decades. Across shorter tenors, 2-year yields rose 60 basis points (“bps”) and 5-year yields rose 64 bps over the last two months. Meanwhile, 55-bp and 36-bp moves at the 10- and 30-year points, respectively, drove the 10-year to 5.28% and the 30-year above 5.60%. The magnitude of the move has sparked intense debate about what is driving rates higher, particularly as yields have reached levels that increasingly matter for consumers, businesses, and financial markets.
It is tempting to reach for the simplest explanation for a move of this size, and this summer offered no shortage of candidates. Rising oil prices, growing concerns about federal deficits, abundant Treasury supply, geopolitical tensions, and questions around long-term inflation have all been cited as potential culprits. Each has likely contributed at the margin, but a closer look at the market's own pricing proves telling.
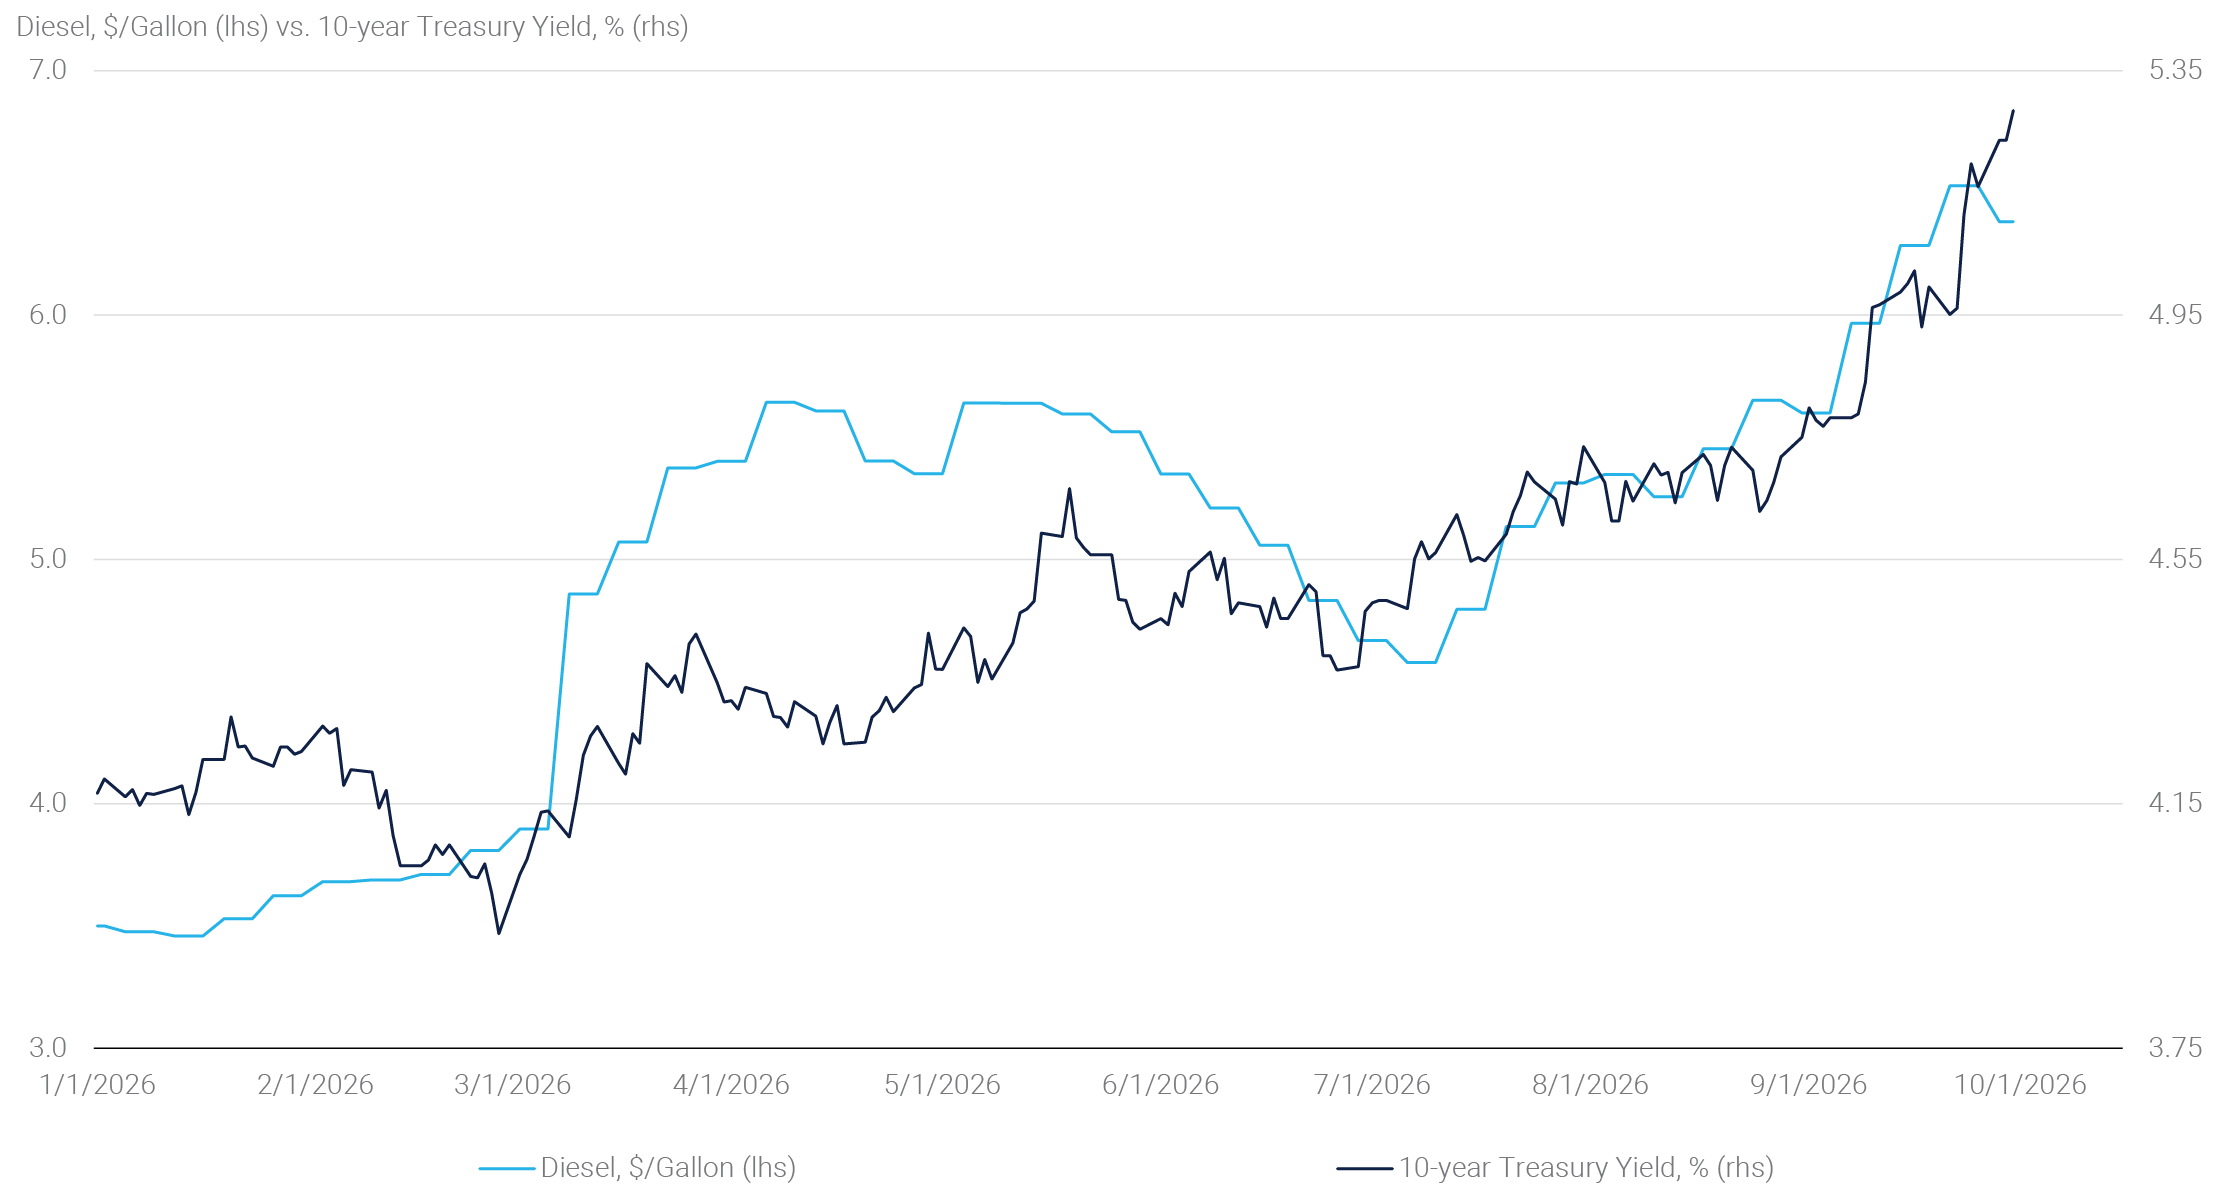
For example, energy markets have received considerable attention. Renewed tensions in the Middle East and damage to refining capacity have kept oil and diesel prices elevated longer than markets expected earlier in the year. The path of the 10-year Treasury yield has tracked fuel prices closely since the spring, naturally inviting comparisons (see panel 1). Higher energy prices can understandably fuel near-term inflation concerns, while geopolitical tensions can raise questions about whether investors should demand greater compensation for uncertainty. Yet the market's response suggests those effects have been secondary to the broader repricing occurring in real rates.
Panel 1:
Energy Prices and Treasury Yields Have Moved in Lockstep
The fiscal picture has been another popular explanation, and it is easy to see why. Gross federal debt crossed the $40 trillion mark in August, there appears to be little concern in Congress about running a roughly 6% budget deficit in a humming economy, and rising yields have increased the government's interest burden. These developments naturally raise concerns about Treasury supply and debt sustainability. Yet the market's own pricing provides only limited support for the idea that fiscal concerns are driving the recent selloff. Term premium measures have remained relatively contained, and one gauge often associated with fiscal stress, the 30-year swap spread, has widened in recent months. The deficit trajectory remains a genuine, slow-burning concern worth monitoring, but it does not appear to be doing the heavy lifting behind this summer's move higher in yields.
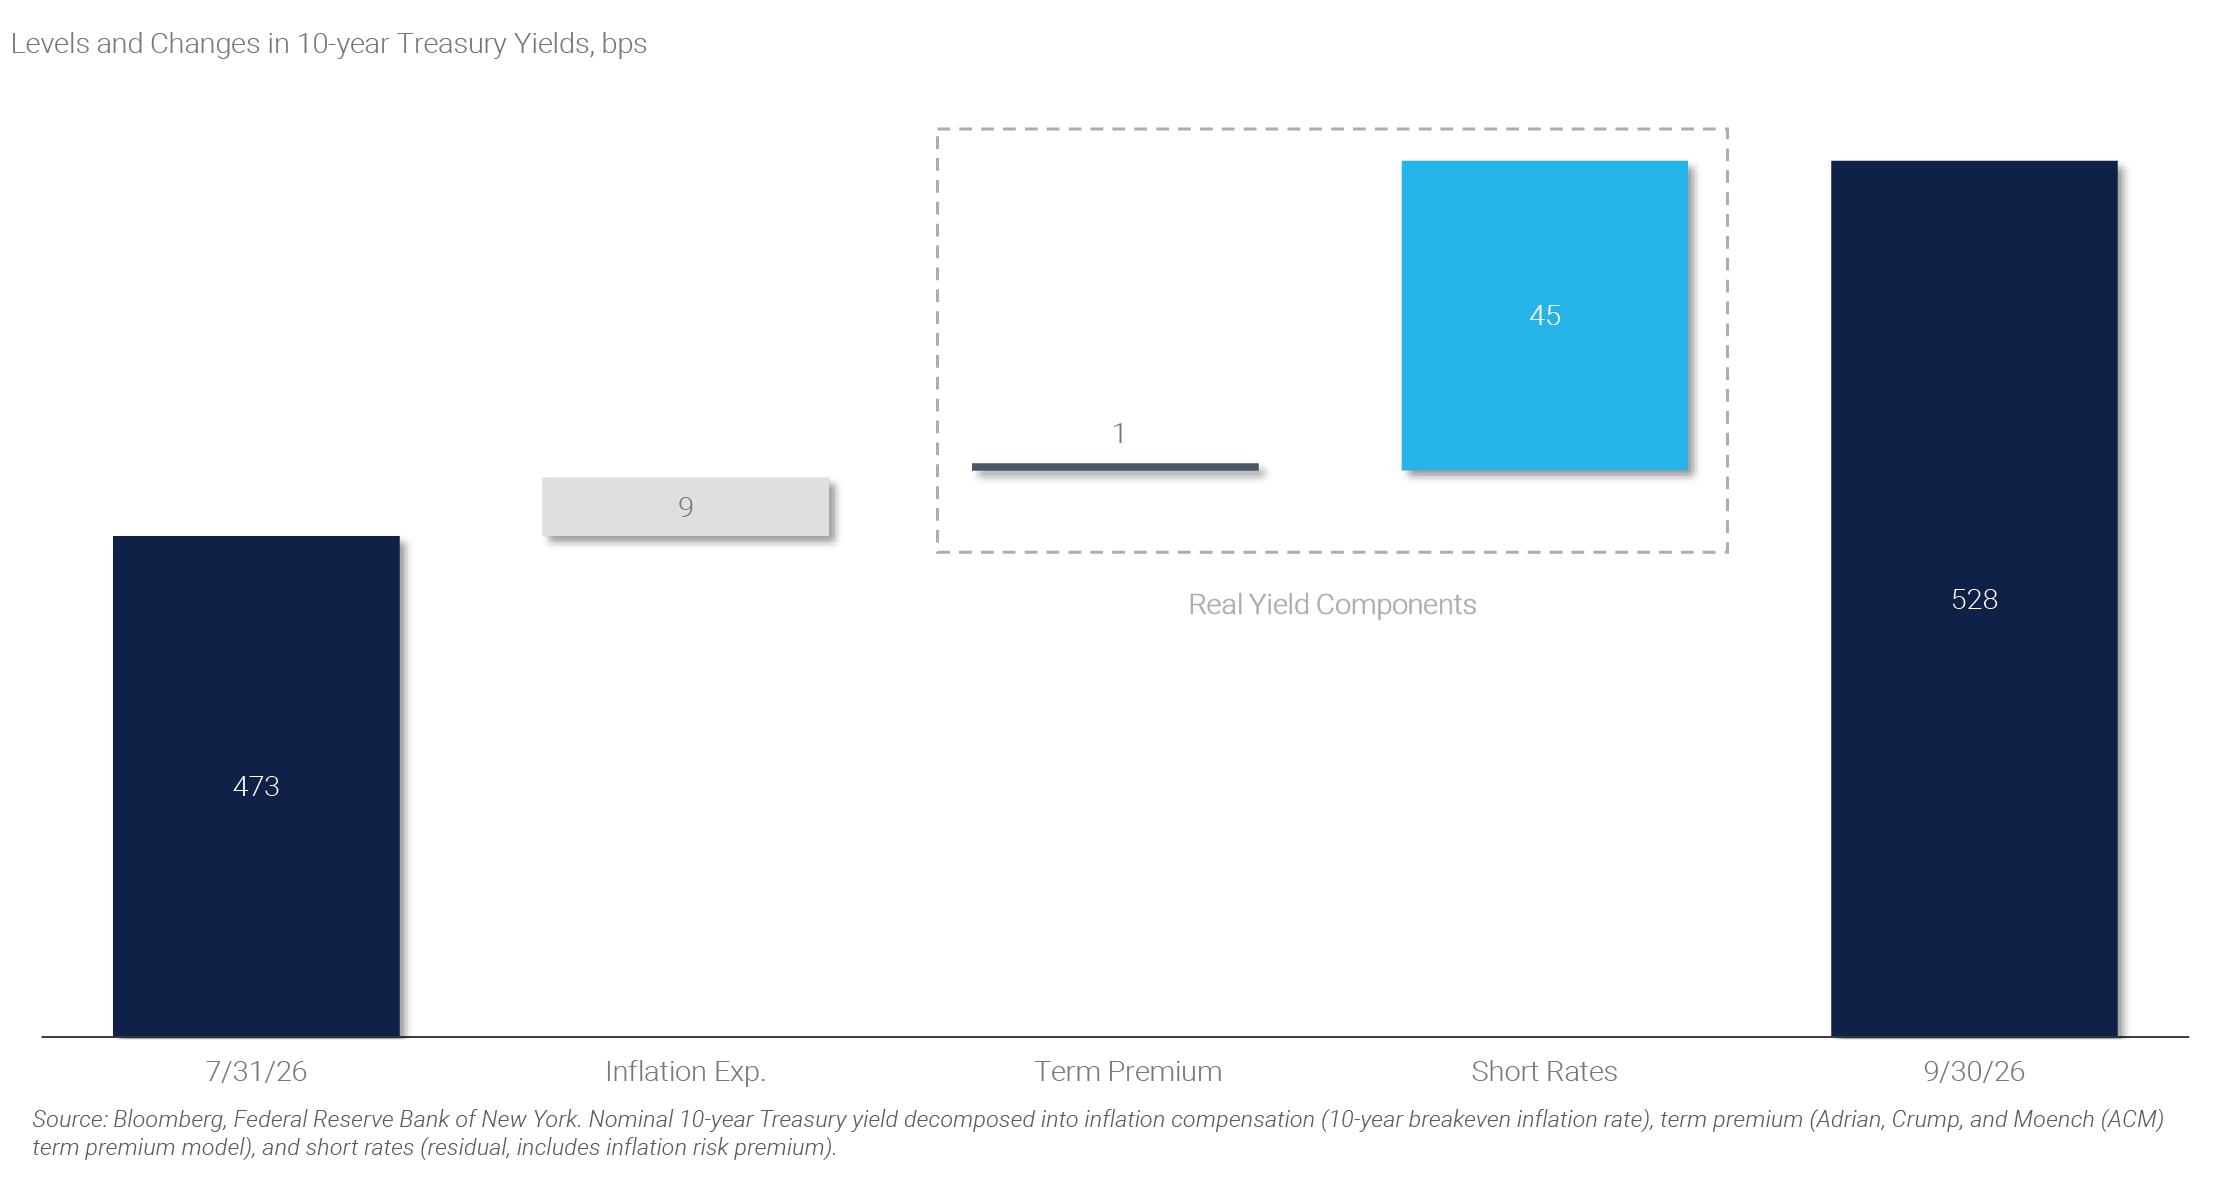
A look under the hood suggests a different story. As shown in panel 2, approximating the 10-year yield changes into its expected short rate, term premium, and inflation expectation components reveals that most of the recent increase has come from higher real yields and a repricing of the anticipated policy path. Inflation breakevens have remained little changed, while term premium has been relatively contained. Rather than reflecting rising inflation fears or fiscal risk, the move increasingly looks like a reassessment of how high policy rates may need to remain and for how long.
Panel 2:
It's a Real Yield Story
The Federal Reserve has been the clearest catalyst for this reassessment. On September 16, the Federal Open Market Committee voted unanimously to raise its target range, its first hike since 2023, and delivered a distinctly hawkish message. Chair Warsh characterized the move as removing a dose of accommodation, citing continued strength in the economy, inflation trends that "weren't passing the test" for sustained improvement, and elevated geopolitical risk. Just as importantly, policymakers signaled that September was unlikely to be the only move higher and markets have responded by materially repricing the expected path of policy rates. Expectations for the terminal policy rate have climbed to 20-year highs, with 1-year-forward 1-year OIS approaching 4.90%, and futures markets pricing roughly 90 bps of additional policy tightening over the next year.
Markets are not only reassessing the Fed's next few meetings, but also the level of rates that may ultimately be required over the long run. The U.S. economy has continued to show resilience despite years of restrictive policy, leading investors to reevaluate where interest rates ultimately need to settle to keep growth in balance (i.e., the “neutral rate”). The AI investment boom has been a common thread across the economic outperformance. Unlike many traditional investment cycles, AI-related investment appears relatively insensitive to borrowing costs and is increasingly financed in debt markets. That dynamic places corporate borrowers in more direct competition with the Treasury market for investor capital and duration demand. At the same time, productivity measures have trended higher alongside rising long-term real yields, a combination that is more consistent with a higher neutral rate rather than a fiscal or inflation story. Taken together, growth resilience, improving productivity, and the capital intensity of the AI buildout suggest real yields may be adjusting to a structurally different economic environment.
Notably, this is not unique to the United States. The rise in yields has been a global phenomenon, with sovereign borrowing costs moving meaningfully higher across developed markets. Japanese 10-year yields are now at their highest level in more than three decades, and government borrowing costs across Europe and the United Kingdom have returned to levels last seen prior to the 2008 Financial Crisis, with yields rising at one of the fastest paces in decades. The unifying theme is a growing recognition that policy rates may remain structurally higher than investors had assumed only a few years ago. Higher yields abroad also reduce the relative attractiveness of Treasuries to some international investors, particularly after accounting for currency hedging costs. The long-standing support that very low overseas yields once provided to Treasuries is considerably weaker today.
Finally, market dynamics appear to have accelerated the move. Trend-following investors added to short positions, and stress that began in European and UK government bond markets spilled over into Treasuries. The selloff was further amplified by convexity flow risk: as yields broke through key levels, holders of negatively convex positions needed to sell duration to stay hedged, reinforcing the very move they were reacting to. These dynamics help explain the speed of the recent selloff without requiring an equally abrupt deterioration in the economic backdrop.
Financial Markets
The challenging interest rate market environment has increased interest rate volatility across expiries and tenors led by the meaningful repricing of Fed funds rate expectations and the pressure on longer term Treasuries primarily seen in the second half of September. Although measures have risen, both implied and realized volatility remain more muted than in 2022-24. This is likely driven by defined Fed rate hikes – meaning the Fed might hike more than previously anticipated, but there is little discussion of hikes larger than 25 bps – compared to several 75 bp increments back in 2022. In addition, despite the pressure on Treasury yields, financial markets continue to function orderly and there has not been a distinct spillover event thus far. For example, the March 2023 Silicon Valley Bank (“SVB”) collapse, which resulted from the shift in Federal Reserve rate hikes and rise in yields, led to meaningful realized volatility and left interest rate volatility measures significantly elevated for several months thereafter.
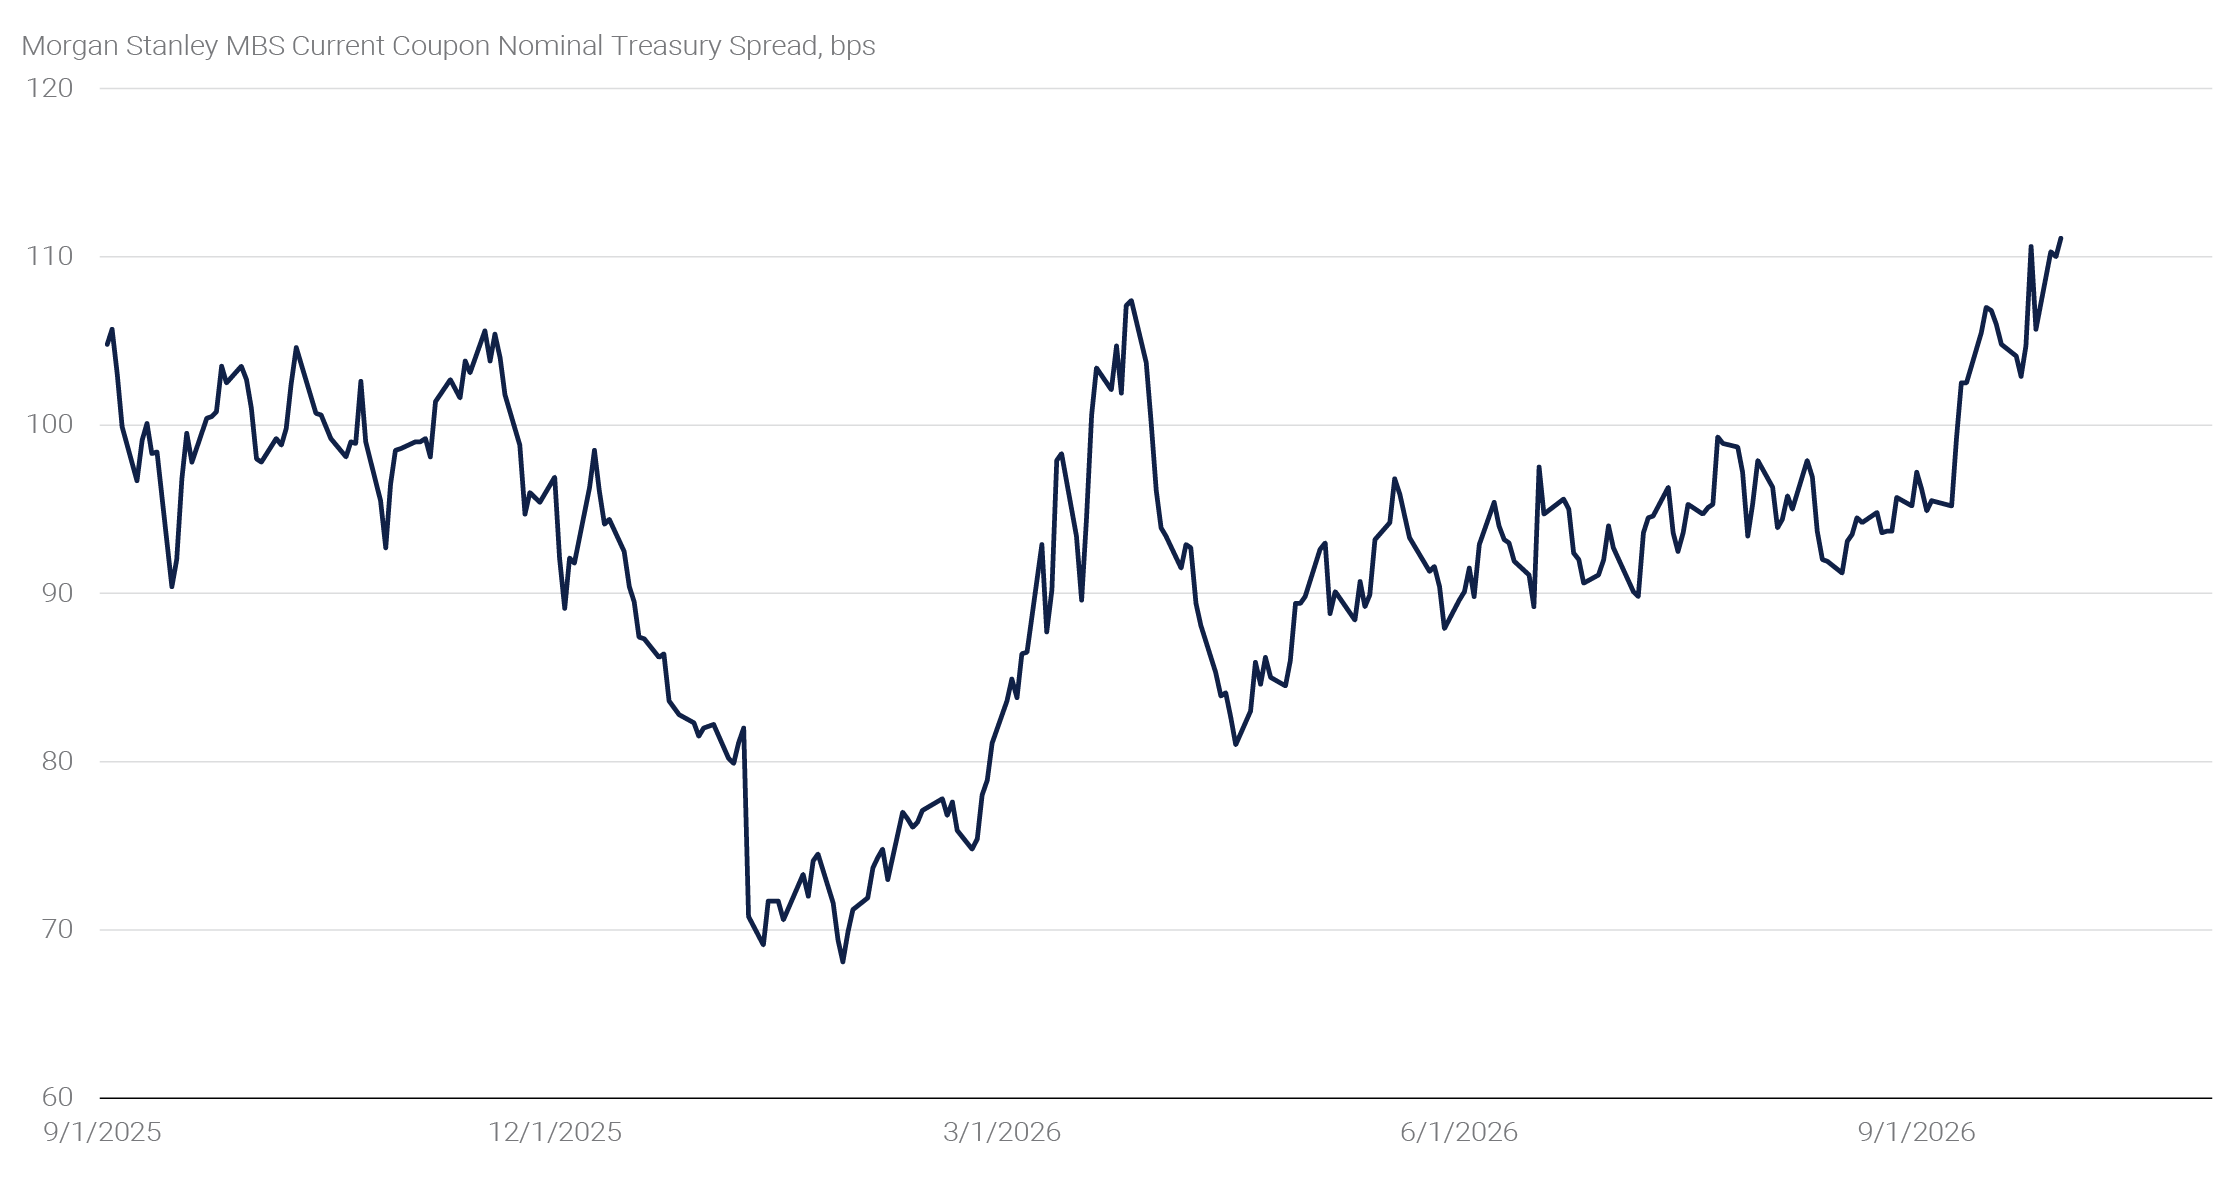
Driven by the increase in interest rate volatility, MBS spreads have widened approximately 16 bps in September, with Morgan Stanley current coupon nominal Treasury spreads reaching their widest levels over the past year (see panel 3). MBS performance was challenged, with the Bloomberg MBS Index posting excess returns of +23 bps and -96 bps in August and September, respectively. The latter represents the weakest monthly excess return since March 2023, triggered by the volatility around SVB. Despite the challenging price performance, Agency MBS fundamentals remain relatively robust and certainly in better shape than during the last hiking cycle. Thus far, we have seen limited evidence of a meaningful slowdown in fund flows, as average flows in Q3 remain relatively similar to the first half of the year. As suggested above, hedging flows might have contributed to the sharp move in yields and widening in MBS spreads, but the mortgage investor base appears much more constructive than in earlier periods, best seen by opportunistic purchases from the GSEs, and the aforementioned fixed income fund flows. In addition, at current elevated mortgage rates, origination supply is muted and MBS convexity has declined considerably.
Panel 3:
MBS Current Coupon Spreads Reach Widest Levels in 12 Months
Equities had solid returns, with the S&P 500 delivering a combined 2.4% total return over August and September. The market remains bifurcated, with technology stocks leading advances on the continued strength in corporate profits and demand for compute related to the A.I. buildout. But higher interest rates have pressured interest rate sensitive sectors, with utility and real estate stocks meaningfully underperforming the market.
The U.S. Economy
Economic data received since our last note shows an economy carrying robust growth momentum paired with a stable labor market and stubborn inflation. Notably, the Q2 growth composition shifted meaningfully in favor of private domestic demand with the monthly data that followed providing further evidence of an accelerating U.S. economy. Inflation, by contrast, moved sideways and remains at an elevated level. Against this backdrop, the Fed hiked for the first time since 2023, as discussed above.
Economic Growth & Labor Market
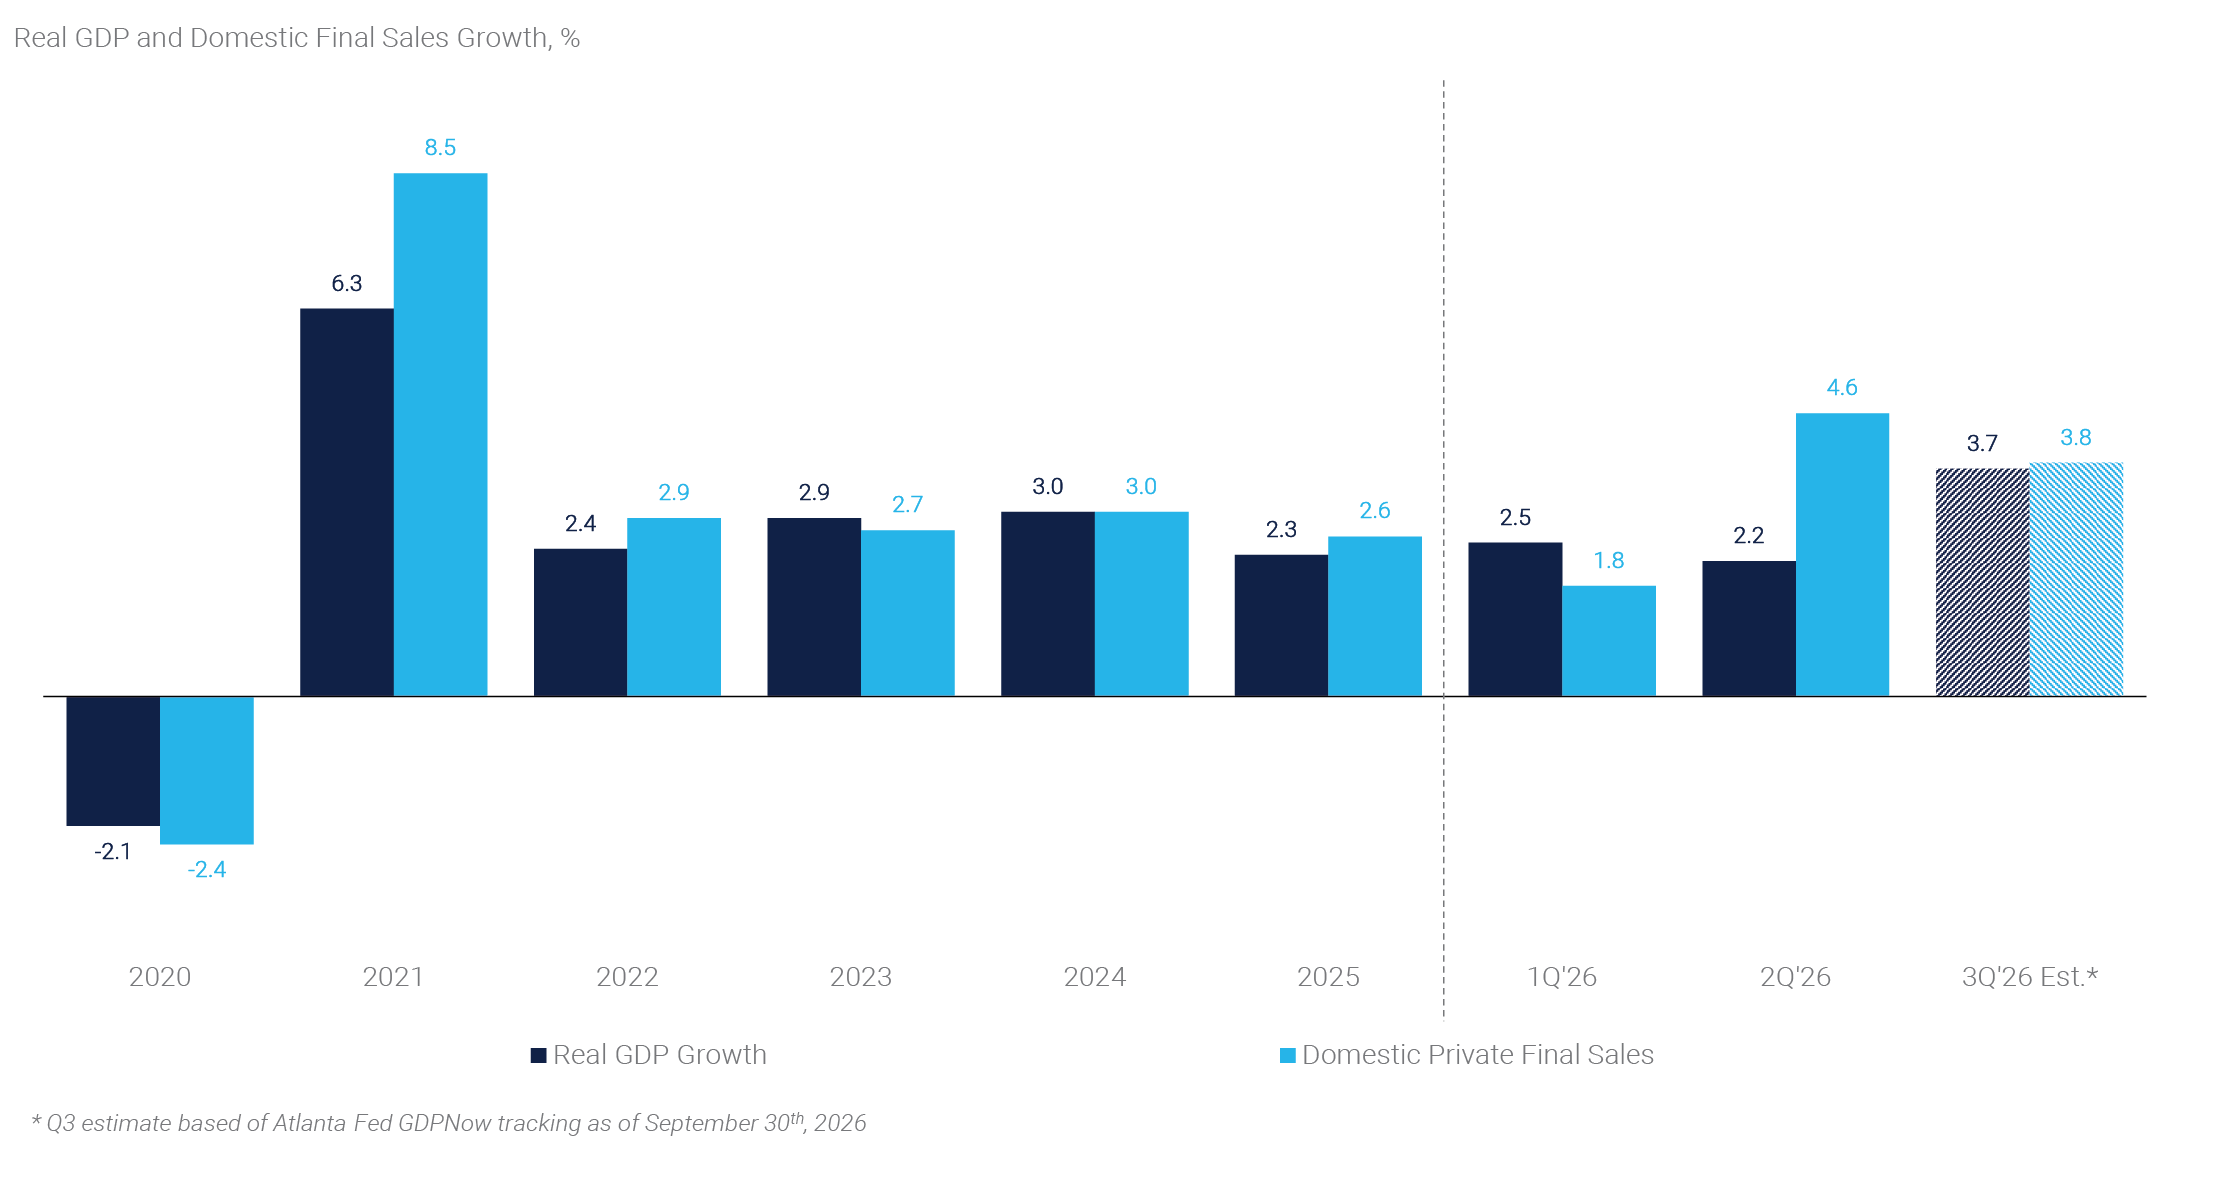
In a clear indication that the headline understates the strength of the domestic economy, the Bureau of Economic Analysis’ (“BEA”) third estimate of Q2 GDP showed a better growth composition. Real final sales to private domestic purchasers — the sum of consumer spending and gross private fixed investment, and arguably the cleanest read on underlying domestic demand — grew at a 4.6% seasonally adjusted annualized rate (“SAAR”), which represents the strongest pace in more than three years (see panel 4) and is expected to grow at a similar pace in Q3.(1) Robust consumer spending was led by services consumption while business investment remains driven by the AI buildout.
Panel 4:
The Economy Appears to be Accelerating
The monthly activity data, which has turned decisively firmer since the end of Q2, points to a consumer and capital expenditure backdrop that is re-accelerating into the second half of 2026. First, the August retail sales report showed a much stronger than expected control group that rose at nearly 3 times the pace of consensus estimates. Moreover, the monthly gains were broad-based across categories. Online sales rebounded 2.6% month-over-month (“mom”), reversing the Amazon Prime Day-driven July pullback. The August personal income and outlays report was also firm, featuring a 0.9% mom rise in nominal consumer spending and a 0.6% mom gain in real terms. The solid consumption numbers were at least in part supported by upward revisions to the personal income data. Additionally, the quarterly release of household balance sheet data showed a $12.8 trillion increase in U.S. household net worth in Q2 that brings the total net worth of households ($195.9 trillion) near the all-time high relative to GDP and a new all-time high relative to disposable income. That said, wealth gains were concentrated in the upper end of the distribution, and the personal savings rate remains near historical lows at 4.1% as of August. Business capital spending also held up with preliminary new orders for manufactured durable goods excluding transportation and defense for the month of August reaching 1.6%.
Meanwhile, the August employment report suggested that the labor market might be in better shape. Nonfarm payrolls increased 162,000, roughly triple the consensus forecast of 53,000, and the prior two months were revised up by a combined 55,000 jobs. The unemployment rate held at 4.1% while labor force participation edged up to 61.6%, a constructive combination. Average hourly earnings rose 0.3% mom and 3.1% year-over-year (“yoy”), a pace broadly consistent with the inflation target but below the current pace of price gains. Job creation was concentrated in the leisure and hospitality sector, while information-related employment declined, a pattern that continues to raise questions about the labor market implications of the AI buildout. Lastly, initial jobless claims remain contained and job openings are little changed. Perhaps most importantly for policymakers, a stable labor market removes a constraint on addressing inflation.
Inflation
The inflation data has offered little comfort with the Fed's preferred gauge remaining above the central bank’s 2% inflation target. The August personal consumption expenditures ("PCE") price index climbed modestly to 3.4% yoy. The core measure was slightly lower, rising 0.2% mom, while the annual rate remained at 3.0%. That said, the lower core inflation rate was heavily impacted by methodological revisions. During its annual revisions, the BEA changed source data for several PCE categories, including computer hardware, legal services, and portfolio management services. As a result of the revisions, the core PCE annual rate fell 36 bps, dropping from 3.3% yoy originally reported for July to 3.0% yoy after the revisions. Outside of the PCE revisions, energy remained the dominant swing factor with gasoline prices having risen 4.1% in August. Even outside of energy prices, services inflation has remained firm, with the core services index, essentially all services outside of housing and energy, remaining around 3.5% yoy.