The Iran war dominated news headlines and market price action throughout the month, resulting in a meaningful decline in risk sentiment, a tightening in U.S. financial conditions, and elevated uncertainty. March ultimately will be remembered as an oil price shock, as military action across the Middle East ended nearly all transport through the Strait of Hormuz (the “Strait”), a shipping lane responsible for nearly 20% of global oil production. The shock from the closure has been propagating across the globe, impacting various countries, industries, and products with effects continuing to be seen.(1) The longer the war carries on, the bigger – and likely more negative – its impact will be on global economic growth and inflation. So far, there are few signs of a clear off-ramp, with both sides appearing entrenched, suggesting the conflict could extend well beyond the originally communicated 4-to-6-week timeline. Meanwhile, media commentary around deescalation continues to diverge from developments on the ground, where activity remains elevated and has included more U.S. military personnel deployed to the Middle East in recent days.
Thus far, oil-producing nations have tried to boost shipping through routes that circumvent the Strait and developed market economies have added to supply through releases of strategic petroleum reserves. The unfortunate truth, however, is that these measures are insufficient to entirely offset the supply shortage. Thus, curbing demand either through higher prices or through government-mandated measures should come into play at some point. The U.S. economy remains significantly more insulated from this oil price shock than countries in Europe and Asia, though coming months will show whether U.S. consumers are willing and able to absorb rising gasoline and diesel prices, which have risen 32% and 39%, respectively, since the start of the war (see panel 1), while sustaining spending. We view the current energy price shock as significantly different than the one in 2022, discussed further below.
Panel 1:
Gas Prices Have Been Rising Sharply
Interest Rate Markets
Financial markets reacted swiftly to the conflict, triggering a sharp and volatile repricing across global interest rate markets. In the U.S., Treasuries sold off notably over the past month as investors reassessed inflation risks, central bank policy paths, and the durability of the pre-war easing narrative. The 10-year Treasury yield rose from roughly 3.95% on February 27, the day before hostilities began, to around 4.32% by the end of March, having briefly peaked near 4.43%. While the move higher in yields was global, the shift in the U.S. was particularly significant given how firmly expectations for rate cuts had been priced just weeks earlier.
At the core of the repricing has been the surge in energy prices. Brent crude spot prices climbed from $71 to $118 per barrel, reigniting inflation risks that markets had largely set aside earlier in the year. As oil prices moved higher, rates increasingly traded as a function of energy prices, with the relationship between daily moves in Brent crude and front-end Treasury yields rising to levels last seen during periods of intense commodity driven inflation. In effect, outright duration positions increasingly became proxies for views on energy.
That said, the pass through to inflation expectations has been uneven across regions, reinforcing the earlier point around relative economic exposure. While oil’s impact on consumer inflation is broadly comparable between the U.S. and Europe, higher gas and electricity prices have a materially larger effect on European inflation dynamics, particularly in the United Kingdom. Market pricing shows gas forward curves remaining elevated well into 2027, while oil forwards begin to roll over by late 2026, suggesting a more persistent inflation impulse abroad. This divergence has driven a more aggressive repricing of expected policy paths for the European Central Bank and Bank of England relative to the Federal Reserve (the “Fed”).
In the U.S., higher yields were driven less by rising inflation expectations and more by investors demanding greater compensation for holding long-dated bonds in an uncertain policy environment. 10-year real yields rose by roughly 33 basis points (“bps”) over the month, reflecting a sharp reassessment of the likely trajectory of monetary policy. By contrast, longer-dated inflation breakevens ended the period little changed, while forward-looking inflation measures retracing toward levels last seen during last year’s Liberation Day turmoil, as investors reduced inflation exposure amid broader risk aversion. For example, the 5-year 5-year forward inflation swap – commonly used as an indicator of longer-term inflation compensation – declined by up to 10 bps during the month.
Monetary Policy
This repricing unfolded alongside the March FOMC meeting, which at first glance appeared relatively benign. The Fed held rates steady, as expected, and the Summary of Economic Projections continued to show a bias toward one cut later this year. That said, a deeper dive into the details signaled a firmer policy stance than the headline outcome suggested. The Fed revised its inflation and growth forecasts upward, and Chair Powell focused heavily on upside risks to inflation expectations in his press conference, while devoting comparatively little time to downside risks in the labor market. While Powell emphasized the unusually high uncertainty stemming from the Iran conflict, markets ultimately interpreted the communication as modestly hawkish.
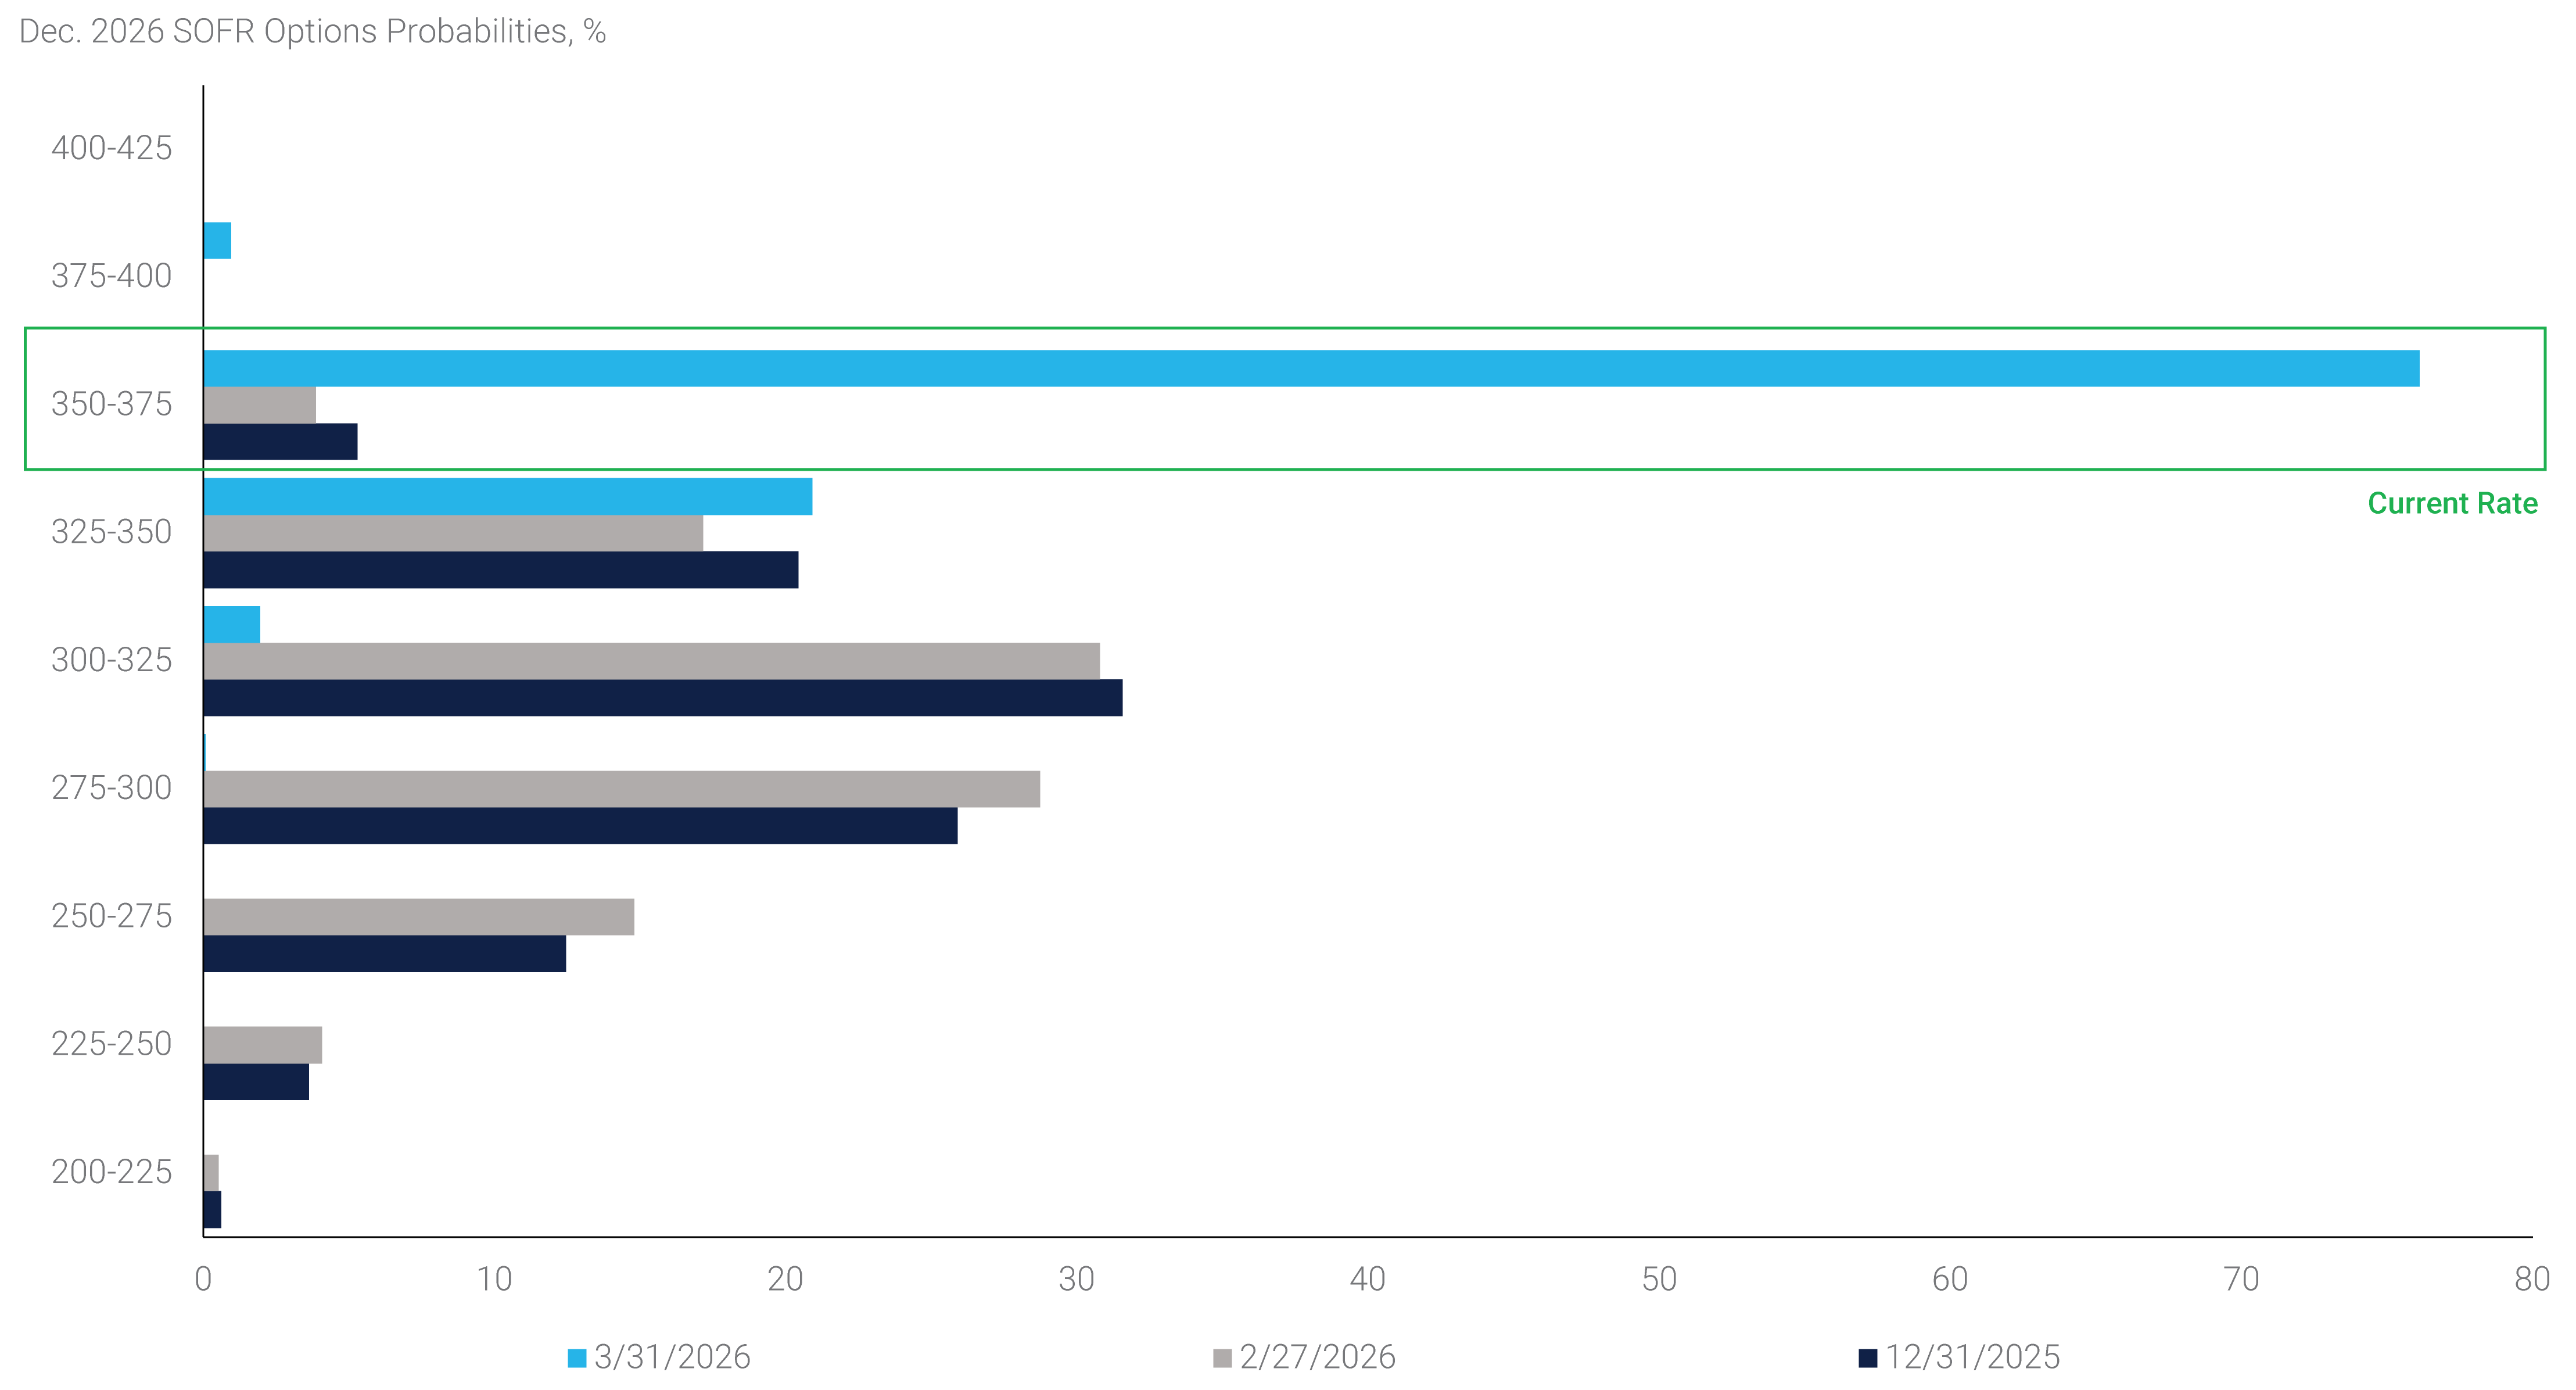
Since then, policy expectations have shifted dramatically. Market implied probabilities as of the end of March assign a much lower likelihood to rate cuts in 2026 and, for the first time in over a year, some odds of rate hikes. Short dated interest rate markets reflect this shift: 1-year forward 1-year overnight index swaps – a widely-watched measure of where policy rates are expected to move roughly one year from now – traded above the effective Federal Funds rate the week of March 23rd. Meanwhile options on December 2026 secured overnight financing rate (“SOFR”) futures price a slight probability of hikes by year end. This marks a sharp reversal from late February, when multiple cuts were still viewed as the baseline scenario (see panel 2).
Panel 2:
Markets Meaningfully Repriced Fed Monetary Policy Expectations for This Year
Interest Rate Volatility
Treasury price action has also been dominated by headline risk. Brief rallies accompanied intermittent signs of diplomatic de escalation, particularly amid more conciliatory rhetoric from Washington, but these moves proved short lived, as renewed concerns over the conflict’s trajectory and fresh spikes in energy prices quickly pushed yields higher again. At the same time, several crosscurrents amplified the headline-driven backdrop, including what appears to be meaningful outflows of foreign central bank Treasury holdings at the Federal Reserve Bank of New York,(2) rising primary dealer balance sheets, which reached a new all-time record of approximately $540 billion, and a deterioration in fixed income fund flows, which had been running at some of the strongest flows in several years ahead of the conflict. The weakening demand also weighed on Treasury supply, with all three month-end Treasury coupon auctions(3) clearing at higher yields than initial pricing.
The cumulative effect has been a meaningful increase in rate volatility. Implied Treasury volatility moved back toward post Liberation Day highs, reflecting both elevated geopolitical uncertainty and the rapid unwinding of previously entrenched positioning for lower rates. In addition, swap spreads have been highly volatile, with 5- and 10-year swap spreads tightening -4.1 and -2.4 bps, respectively, once again reflecting that Treasuries trade with higher correlations to risk assets than they have in the past.
Risk Assets and Agency MBS
Given the spike in oil prices and volatility in interest rate markets, risk assets faced pressure for most of March, with the S&P 500, at -5.0%, delivering the weakest monthly economic return in a year. The negative return was driven by a deterioration in risk sentiment and investor repositioning as the energy sector marked the only sector with a positive return during March. Outside of the war, news about private credit continued to weigh on financial sector stocks and kept the nagging narrative that the sector could be facing trouble while technology stocks faced continued concerns around the impact of AI on the software sector. Altogether, investor redemptions continue to remain well above fund redemption allowances.
Relative to other risk assets, Agency MBS performed admirably, with the aggregate Bloomberg U.S. MBS Index delivering a modestly negative excess return of -28 bps on the month. Within the coupon stack, intermediate coupons lagged as they bore the brunt of investors looking to move up the stack as yields sold off. Of note, mortgage rates, which had briefly fallen below 6% in February after the GSE purchase announcement, have risen sharply in March, with the Freddie Mac primary mortgage rate reaching 6.38% at the end of the month.
The U.S. Economy – That Was Then, This is Now
According to the economic data – which now feels somewhat stale given that it mostly reflects pre-war conditions – the U.S. economy continues to expand despite a weak labor market and rising inflationary pressures. As we grapple with the uncertainty of war and the resulting oil-supply shock that is creating new challenges for policymakers, businesses, and consumers, we compare today’s situation with the start of the Russia-Ukraine war.
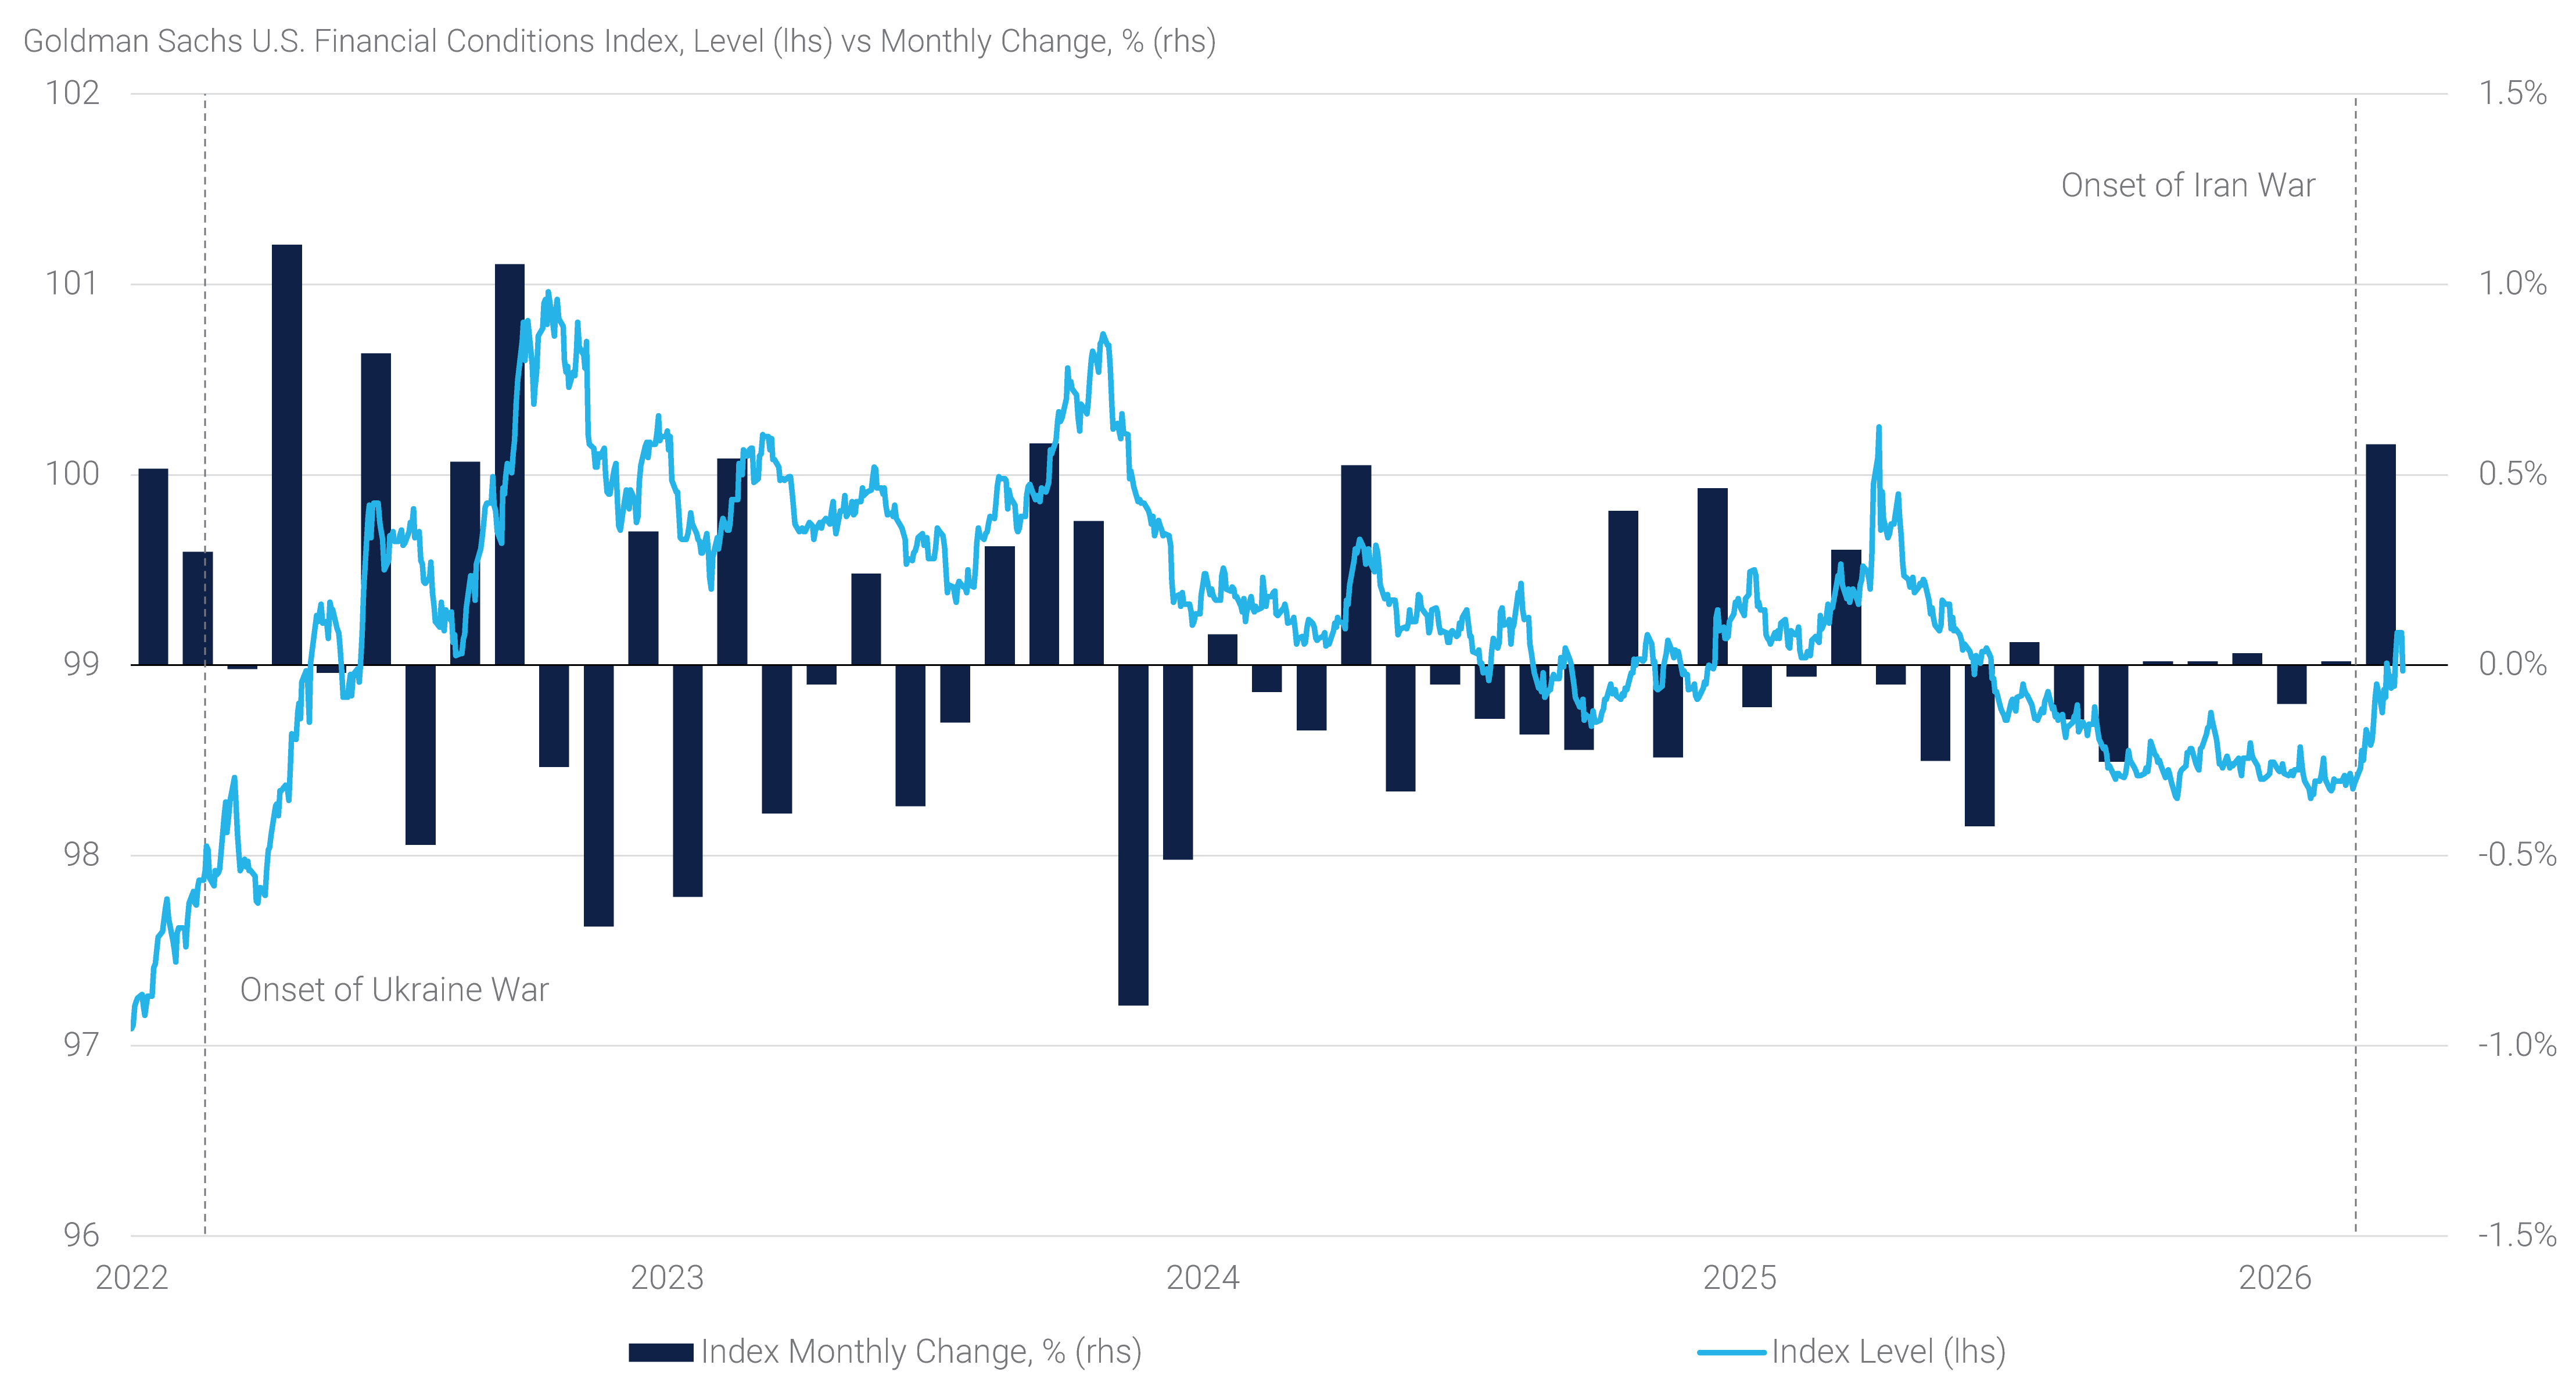
When Russia invaded Ukraine in early 2022, the U.S. economy was still coming off a powerful post pandemic reopening surge. Policy rates were near zero and credit was broadly available on relatively easy terms. Aggregate demand was strong, the labor market was exceptionally tight, and inflation was running hot following months of supply-chain disruptions and fiscal / monetary stimulus. The resulting energy shock acted as an accelerant: energy and food prices jumped, inflation expectations rose, and the Fed pivoted into an aggressive tightening campaign. Financial conditions, while beginning to be repriced, were still relatively easy (see panel 3), and households and firms had meaningful buffers in the form of excess savings and robust cash flow. In other words, consumers and businesses were able to absorb higher prices without immediately slamming on the brakes.
Panel 3:
Financial Conditions(4) Tightened Meaningfully in March
In contrast, the U.S. economy at the onset of the Iran war is starting from a much higher interest rate and tighter credit baseline. Inflation has cooled off its peak but remains a key sensitivity, especially given the recent firmness in non-shelter services inflation and the nearly five years of above-target price gains. As noted above, this has left the Fed far less likely to “look through” an oil shock. With tighter financial conditions, thinner pandemic-era buffers, and pressure on equity markets, both consumers and businesses appear more vulnerable. This is particularly true for lower-income consumers, who are more exposed to rising debt-service burdens and any further deterioration in the labor market.
As a result, an extended energy disruption caused by the war is less about “adding fuel” to an overheating demand cycle as in 2022 and more about policy and credit constraints interacting with consumer health. A prolonged surge in oil prices could reaccelerate inflation and make the Fed more cautious about easing. In turn, high borrowing costs and tighter credit availability could weigh on consumer spending and business investment — turning a geopolitical inflationary shock into a broader growth slowdown through the rates-and-credit channel.
Inflation and Economic Growth
Inflation remains a central concern, particularly given the ongoing dislocation in energy markets. The Bureau of Labor Statistics (“BLS”) reported that February consumer price index (“CPI”) inflation was in line with expectations, with the headline index rising 0.3% month-over-month (“mom”) and the core index gaining 0.2% mom. The headline reflected rebounds in food and energy, while the core was characterized by firm services offset by benign goods print. Most notably, core services inflation excluding shelter was firm at 35 bps mom and has reaccelerated to start 2026, reaching 4.8% on an annual basis.
At the same time, upstream price pressures have been more concerning. February producer price index (“PPI”) inflation was much higher than expected: final demand prices rose at more than double the consensus estimates while core PPI featured broad-based firmness. Viewed through the personal consumption expenditure (“PCE”) lens, CPI and PPI components were generally hot – pointing to a February PCE print that should round to 0.4% mom. Looking ahead, we expect the war is likely to keep headline prints elevated via energy and food prices. In addition, standard rules of thumb suggest current oil prices are consistent with a 0.2 percentage point uplift to core PCE, implying the Fed’s preferred gauge will remain above 3% over the coming months.
While most initial analyses of the conflict’s economic impact have focused on inflation, with the war entering its second month, attention is shifting towards the demand-destruction implications for growth. Likewise, growth momentum appears to have slowed ahead of the war, with the Bureau of Economic Analysis cutting in half their estimate of real GDP growth in the fourth quarter of 2025 to 0.7% seasonally adjusted annualized rate (“SAAR”). The growth downgrade reflected weaker consumption (2.0% vs. 2.4% SAAR), especially for services (2.7% vs. 3.4% SAAR), and lower total investments (3.3% vs. 3.8% SAAR). As a result, real final sales to private domestic purchasers slowed to 1.9% from 2.3% SAAR. Looking forward, whether the economy can sustain its momentum and return to a path of stable growth and prices will depend heavily on how events in Iran evolve.
Labor Market
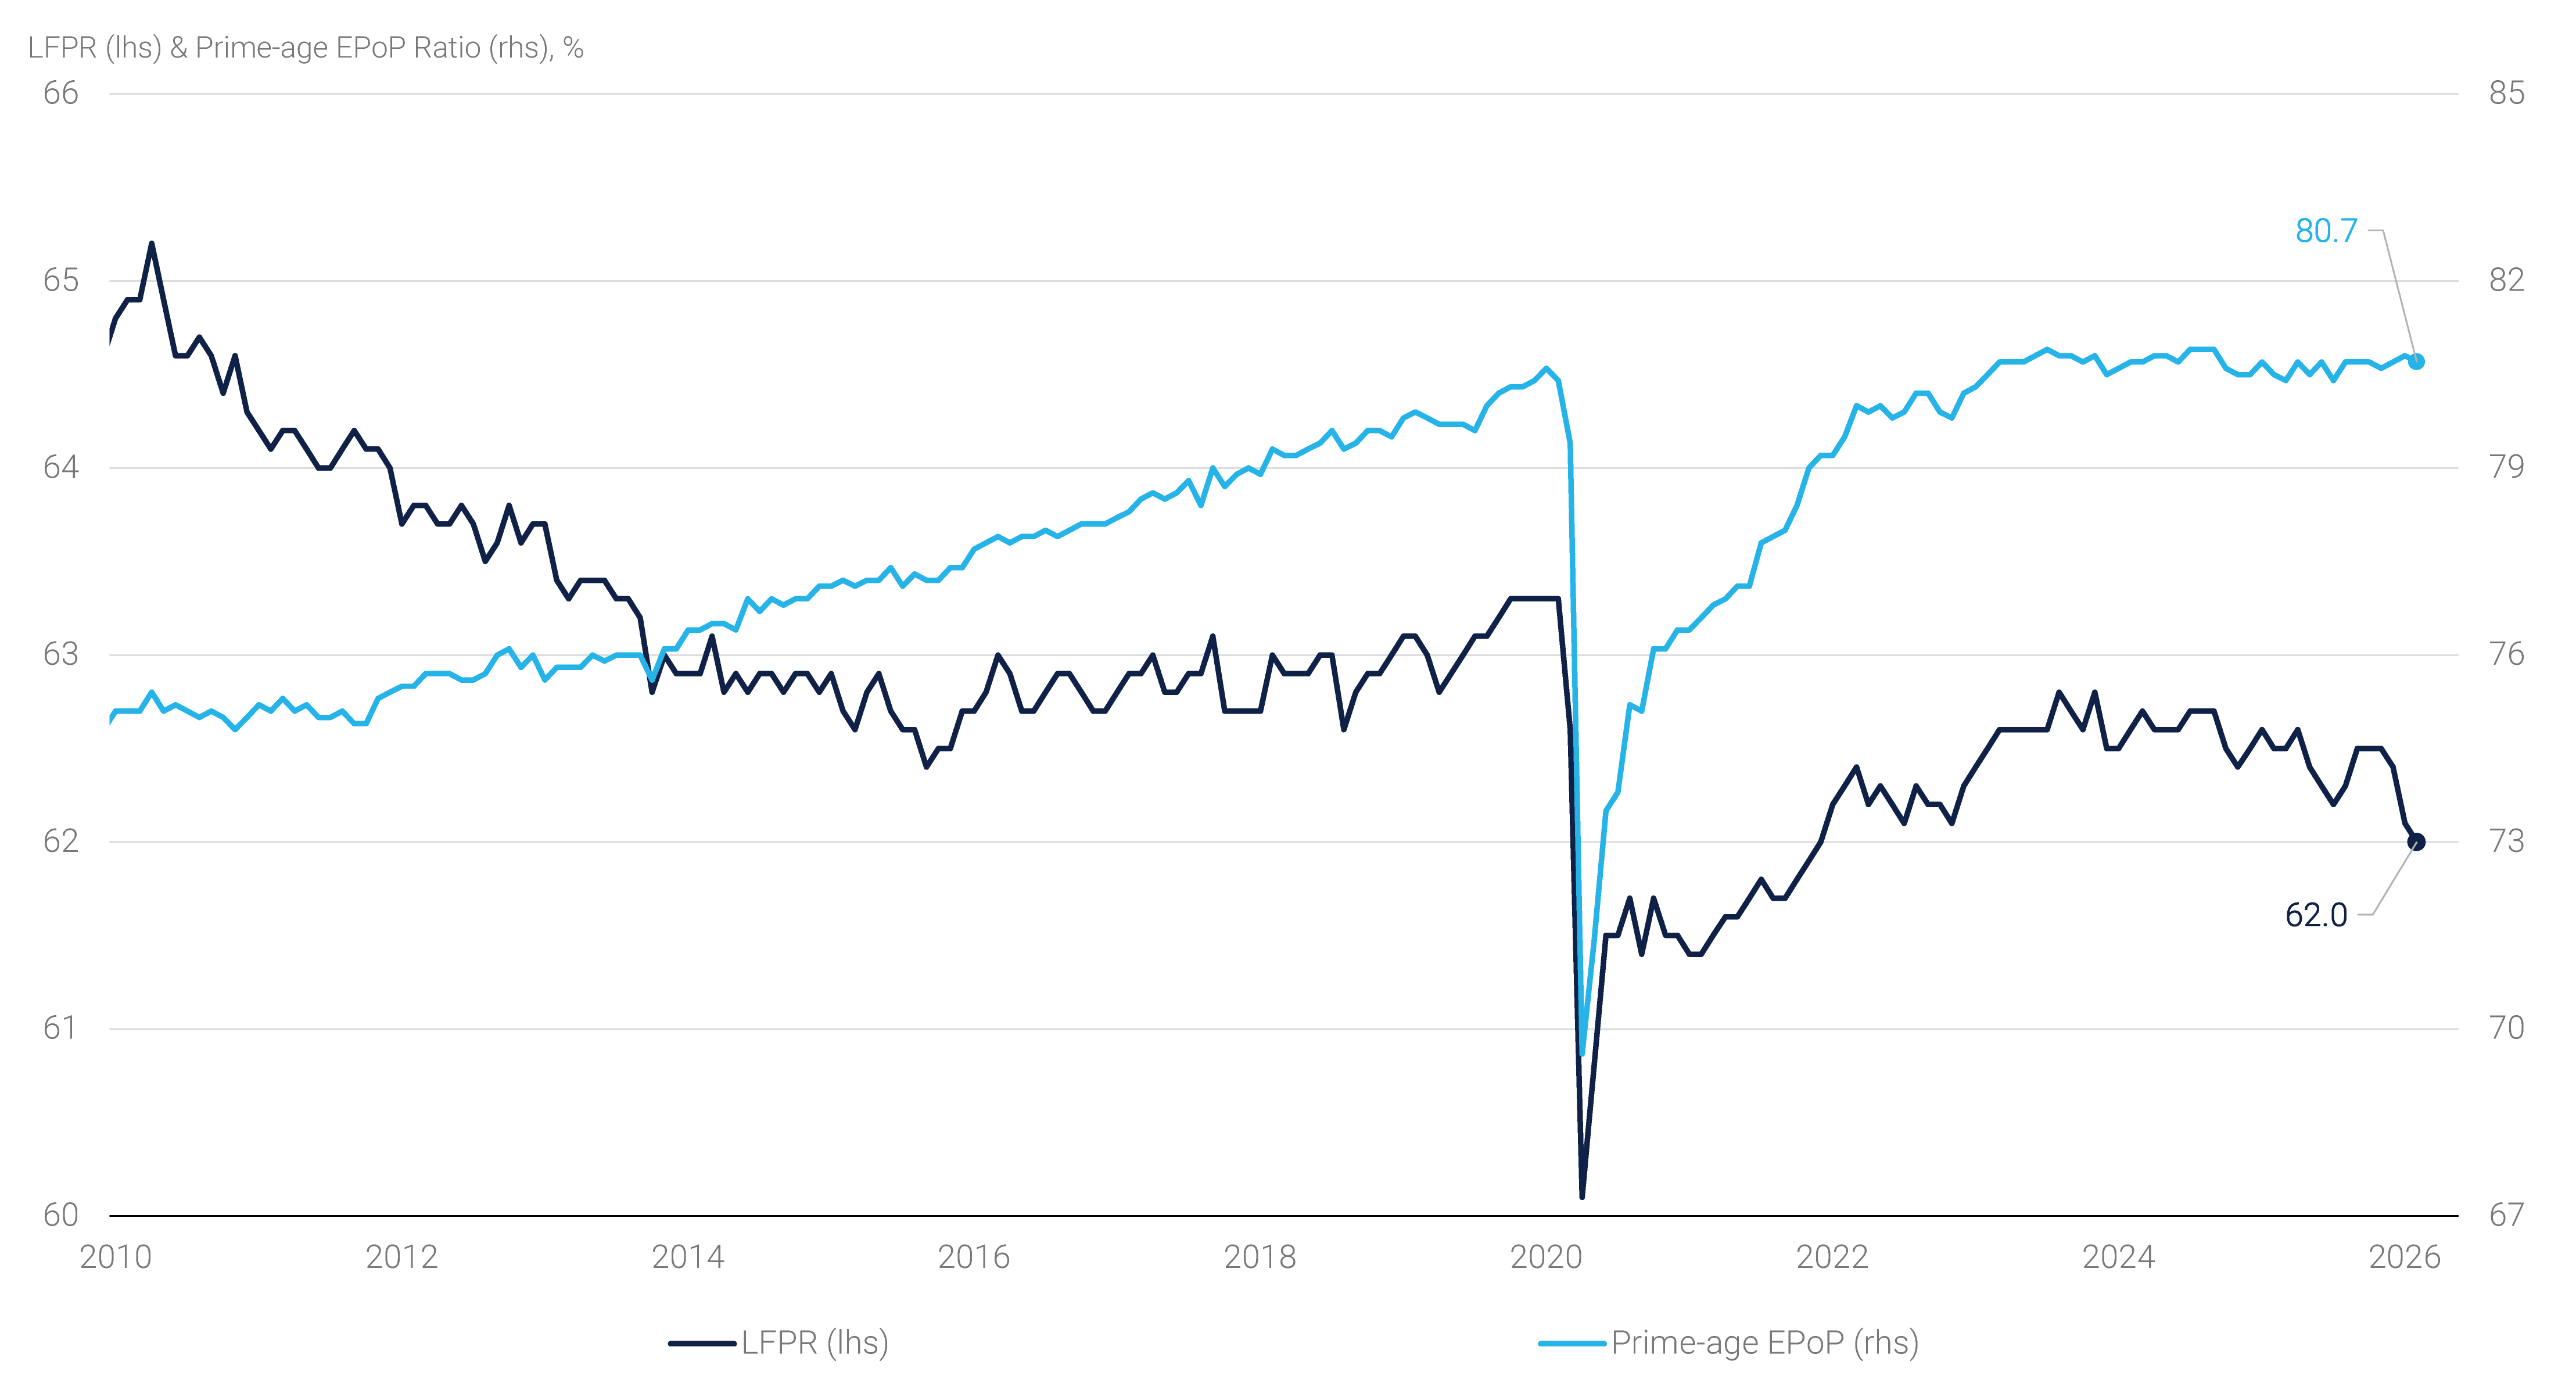
A materially weaker-than-expected February jobs report threw cold water on the nascent “labor market stabilization” narrative. According to the BLS, employers shed 92k jobs in February – well below all Bloomberg economist forecasts and the second lowest monthly print since 2021. Declines in private sector payrolls were broad-based with 8 out of 10 sectors shedding jobs, while revisions to the prior two months were sizeable (-69k). Consequently, the 3-month moving average (“3MA”) payrolls dropped to essentially zero (+6k), and the 3MA private payrolls trend also deteriorated to 18k from 70k last month. While some of the weaknesses can be attributed to one-off factors, such as poor weather and healthcare workers’ strikes, job growth was weak even when excluding those factors. The unemployment rate rose to 4.4% from 4.3% in January, driven by a large decline in employment (-185k) and a small increase in the civilian labor force (18k). Of note, job growth has run below the breakeven rate of job growth over the past nine months and has been negative for five of those months. That said, one should keep in mind that, as highlighted by the sharp differences between the January and February payroll reports, monthly changes have been volatile.
Additionally, the report included the annual population benchmark revision which resulted in a 1.03m drop in the labor force in January and an 895k drop in employment according to the household survey. Those revisions resulted in a significant decline in the labor force participation rate (“LFPR”) to 62.0%. However, the prime-age (25-54) employment-to-population ratio (“EPoP”) held relatively steady at 80.7% (see panel 4).
Panel 4:
Annual Population Benchmark Revisions Lead to Drop in Labor Force Participation