Markets have grappled with a number of meaningful events in February, including:
- The ongoing joint military operation by the U.S. and Israel seeking regime change in Iran;
- The Kevin Warsh Fed Chair nomination;
- The Supreme Court IEEPA ruling;
- Sanae Takaichi’s Liberal Democratic Party winning a decisive two-thirds majority in the Japanese parliamentary elections; and
- Continued AI disruption across equities.
Starting with the situation in the Middle East, the U.S. and Israel launched major combat operations in Iran aimed at “eliminating imminent threats from the Iranian regime” over the weekend. Clearly, this is a fluid situation with lots of unknowns whose full impact on markets and the economy will evolve as the facts on the ground develop. For the time being, we expect a modest impact to growth, inflation, and monetary policy absent a prolonged conflict or long-term disruptions to key shipping routes in the Strait of Hormuz. Looking ahead, however, Treasury yields could rise if investors expect higher inflation and increased military spending — a shift that would add pressure to the U.S. fiscal outlook.
Turning to Kevin Warsh’s nomination as the next Fed Chair, markets have shown limited reaction thus far, as Warsh is seen as an insider who historically leaned hawkish on rate policy when he was a Fed Governor from 2006-2011. Warsh has publicly offered little concrete information related to what he would do as Fed Chair, although there is plenty of speculation given President Trump’s preference for lower rates and his past views with respect to a smaller balance sheet – a stance that could potentially run counter to the Administration’s current efforts to exert greater control over long-term Treasury yields. Nevertheless, many surmise that a Fed Chair Warsh could result in a new Treasury-Fed accord, leading to closer cooperation between the two institutions – particularly on balance sheet matters – but implementation might be difficult and remains highly speculative.
Ultimately, market participants will have to wait for more information from the incoming Fed Chair, whose confirmation hearings currently seem to be held up by Senator Tillis’ (R-NC) refusal to advance Warsh’s nomination until the investigation into Fed Chair Powell’s congressional testimony is concluded. Fed communication in February stressed the fact that several Federal Open Market Committee (“FOMC”) members are wary about the continued firm inflation readings and the January FOMC meeting minutes stated that these individuals would have preferred to characterize risks around the monetary policy outlook as two-sided – a hint to markets that the Fed could opt to hike interest rates if inflation does not slow further in coming months. All of this suggests that the incoming Fed Chair might have difficulties bringing along the FOMC, particularly as long as economic data remains resilient and inflation trends above target.
Panel 1:
Tariffs(1) Expected to Decline Following the Supreme Court Ruling
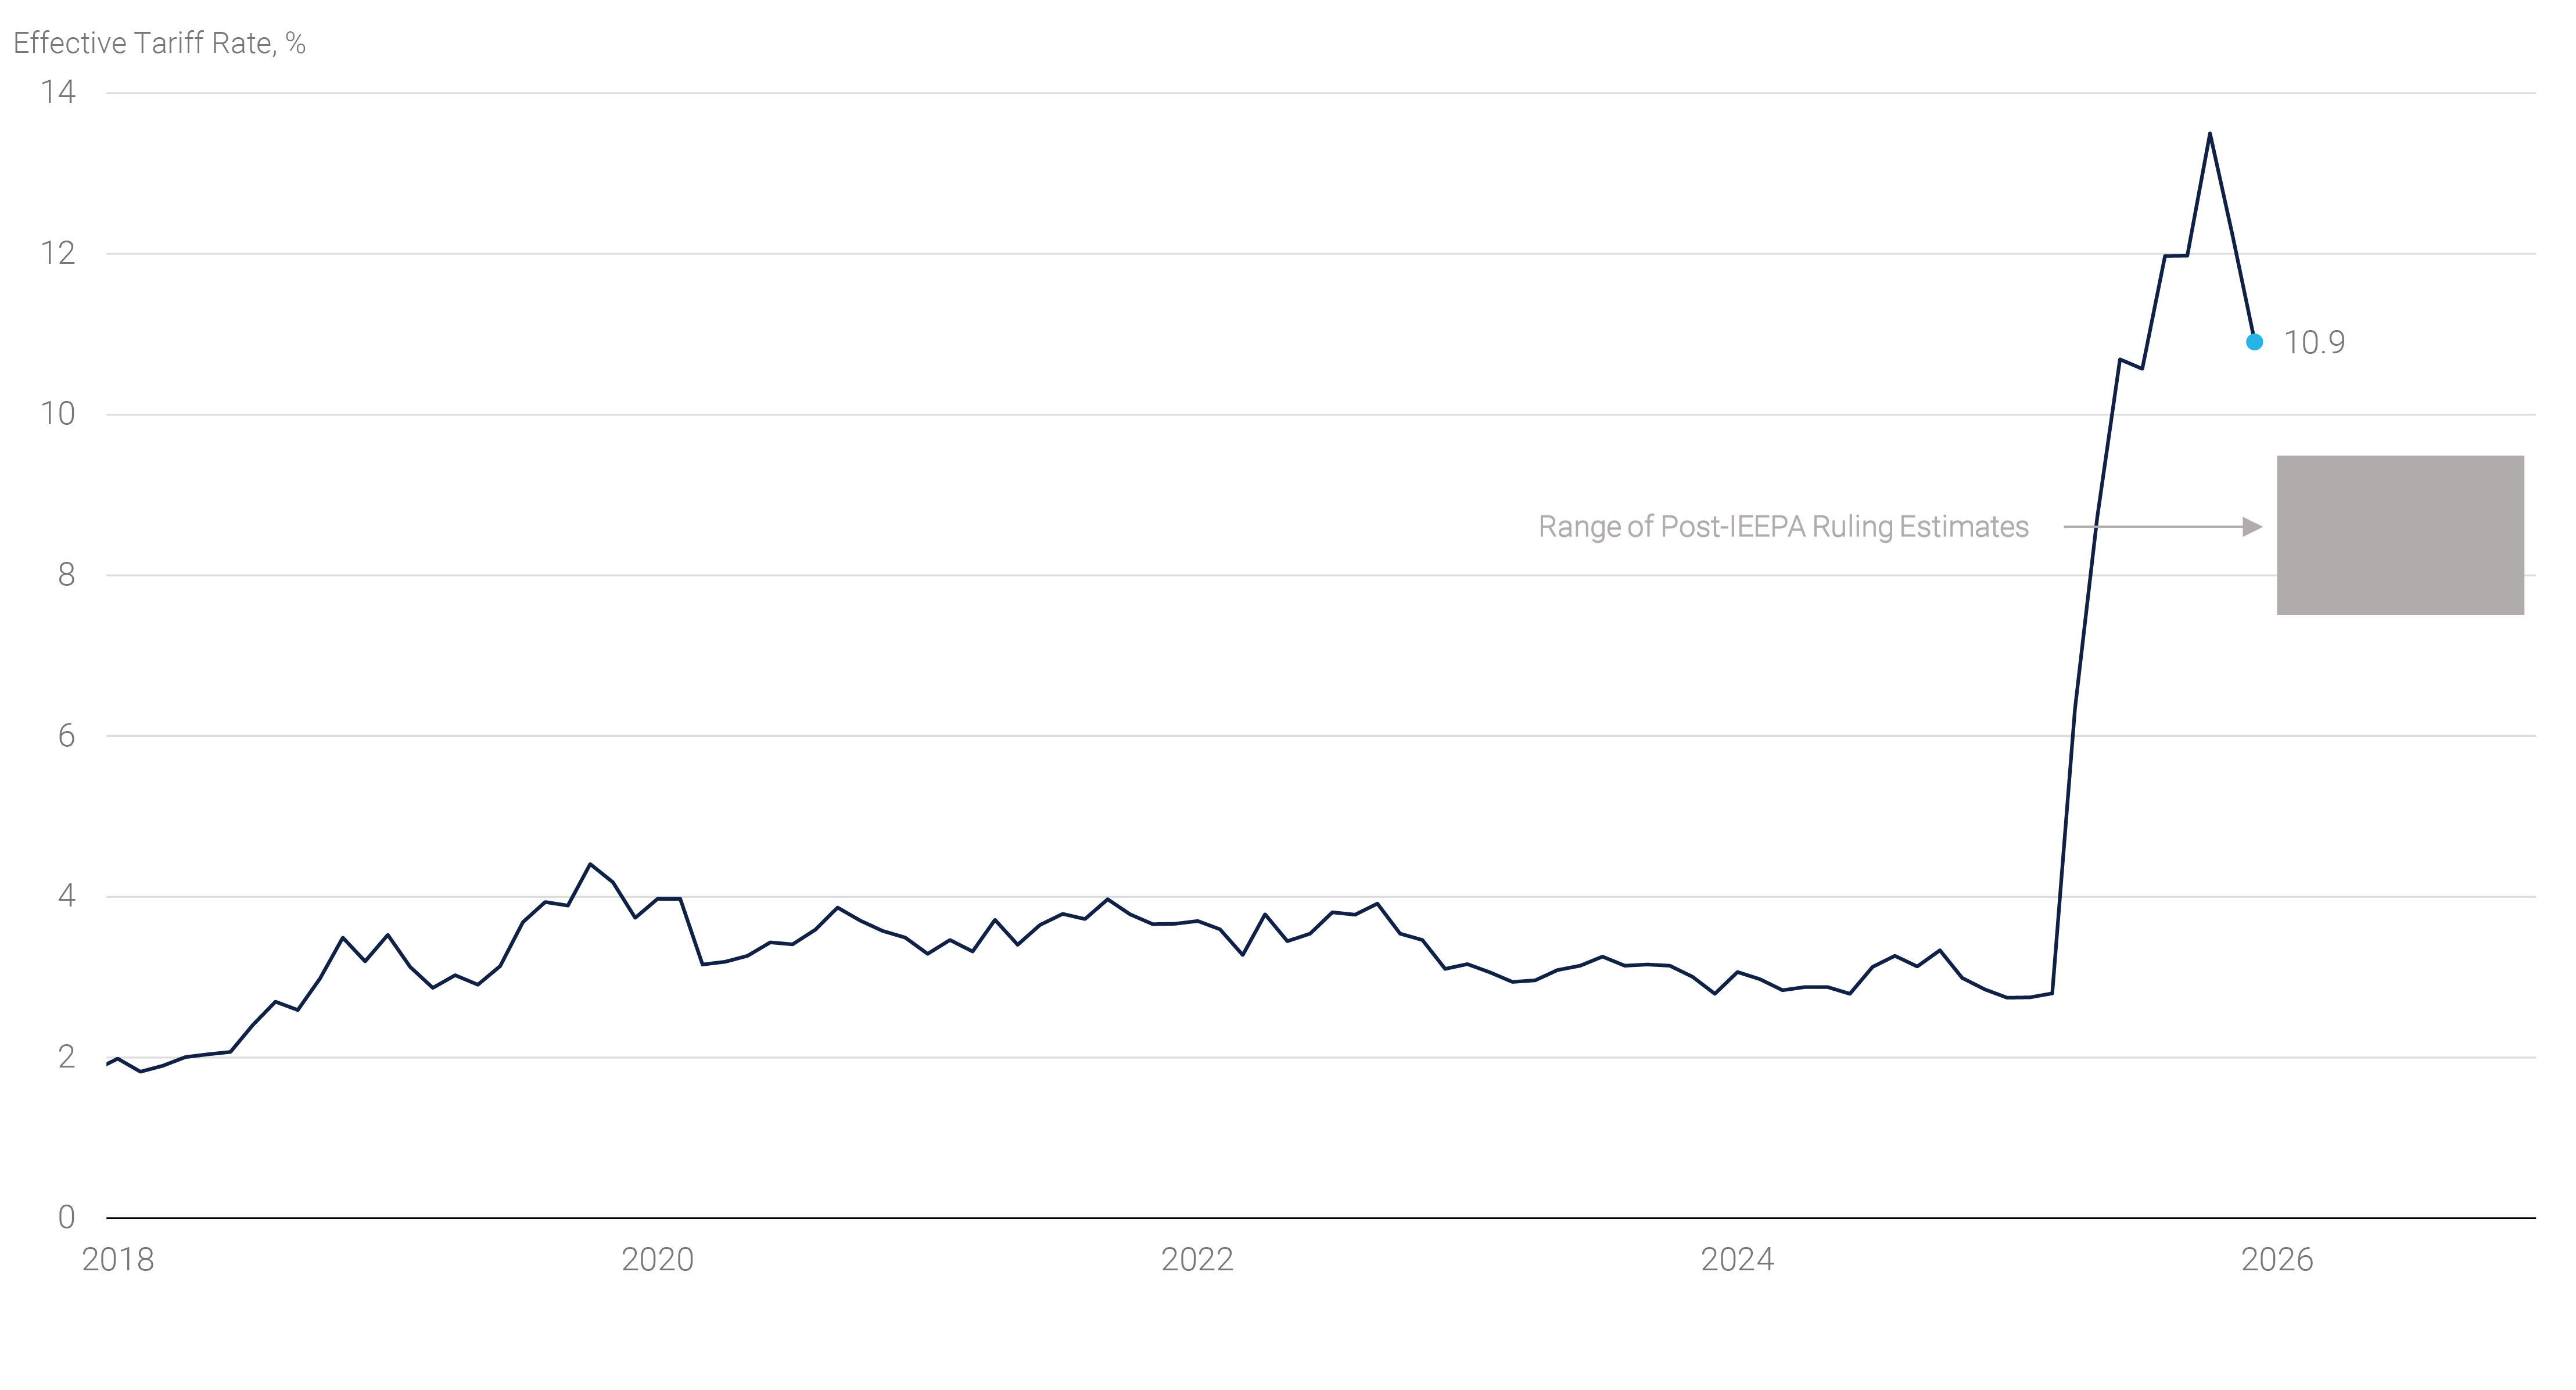
The Supreme Court’s tariff ruling was widely expected and ultimately did little to impact markets in the near term, as some major questions, including how much of the tariffs have to be refunded, were not determined. Following the legal defeat, the Administration announced a new global tariff under different statutes, which is expected to remain in place for the next 150 days. In the meantime, plans to ramp up other measures in an effort to replace much of the revenue with other tariffs appear to be underway. While market participants are uncertain as to how much impact there will be, few have meaningfully changed their outlooks in light of the ruling. Initial estimates about the effective tariff rates under the new regime appear to be in the 7.5 - 9.5% range, modestly lower than in the second half of 2025, yet not a catastrophe for the fiscal outlook (see panel 1).
The fiscal outlook was a major driver of global rates markets, as the reaction to the Liberal Democratic Party victory surprised many observers and led to a clear “buy Japan” market reaction, with the Japanese Yen rallying 0.7% since the February 8th election, while Japanese stock markets saw strong gains and long-term Japanese government bond yields declined meaningfully in Japan and elsewhere in February (see panel 2). The price action appears to be driven by reduced market concerns about expansionary fiscal policy and more clarity around the Bank of Japan’s monetary policy.
Panel 2:
Global Bond Yields Rally in February
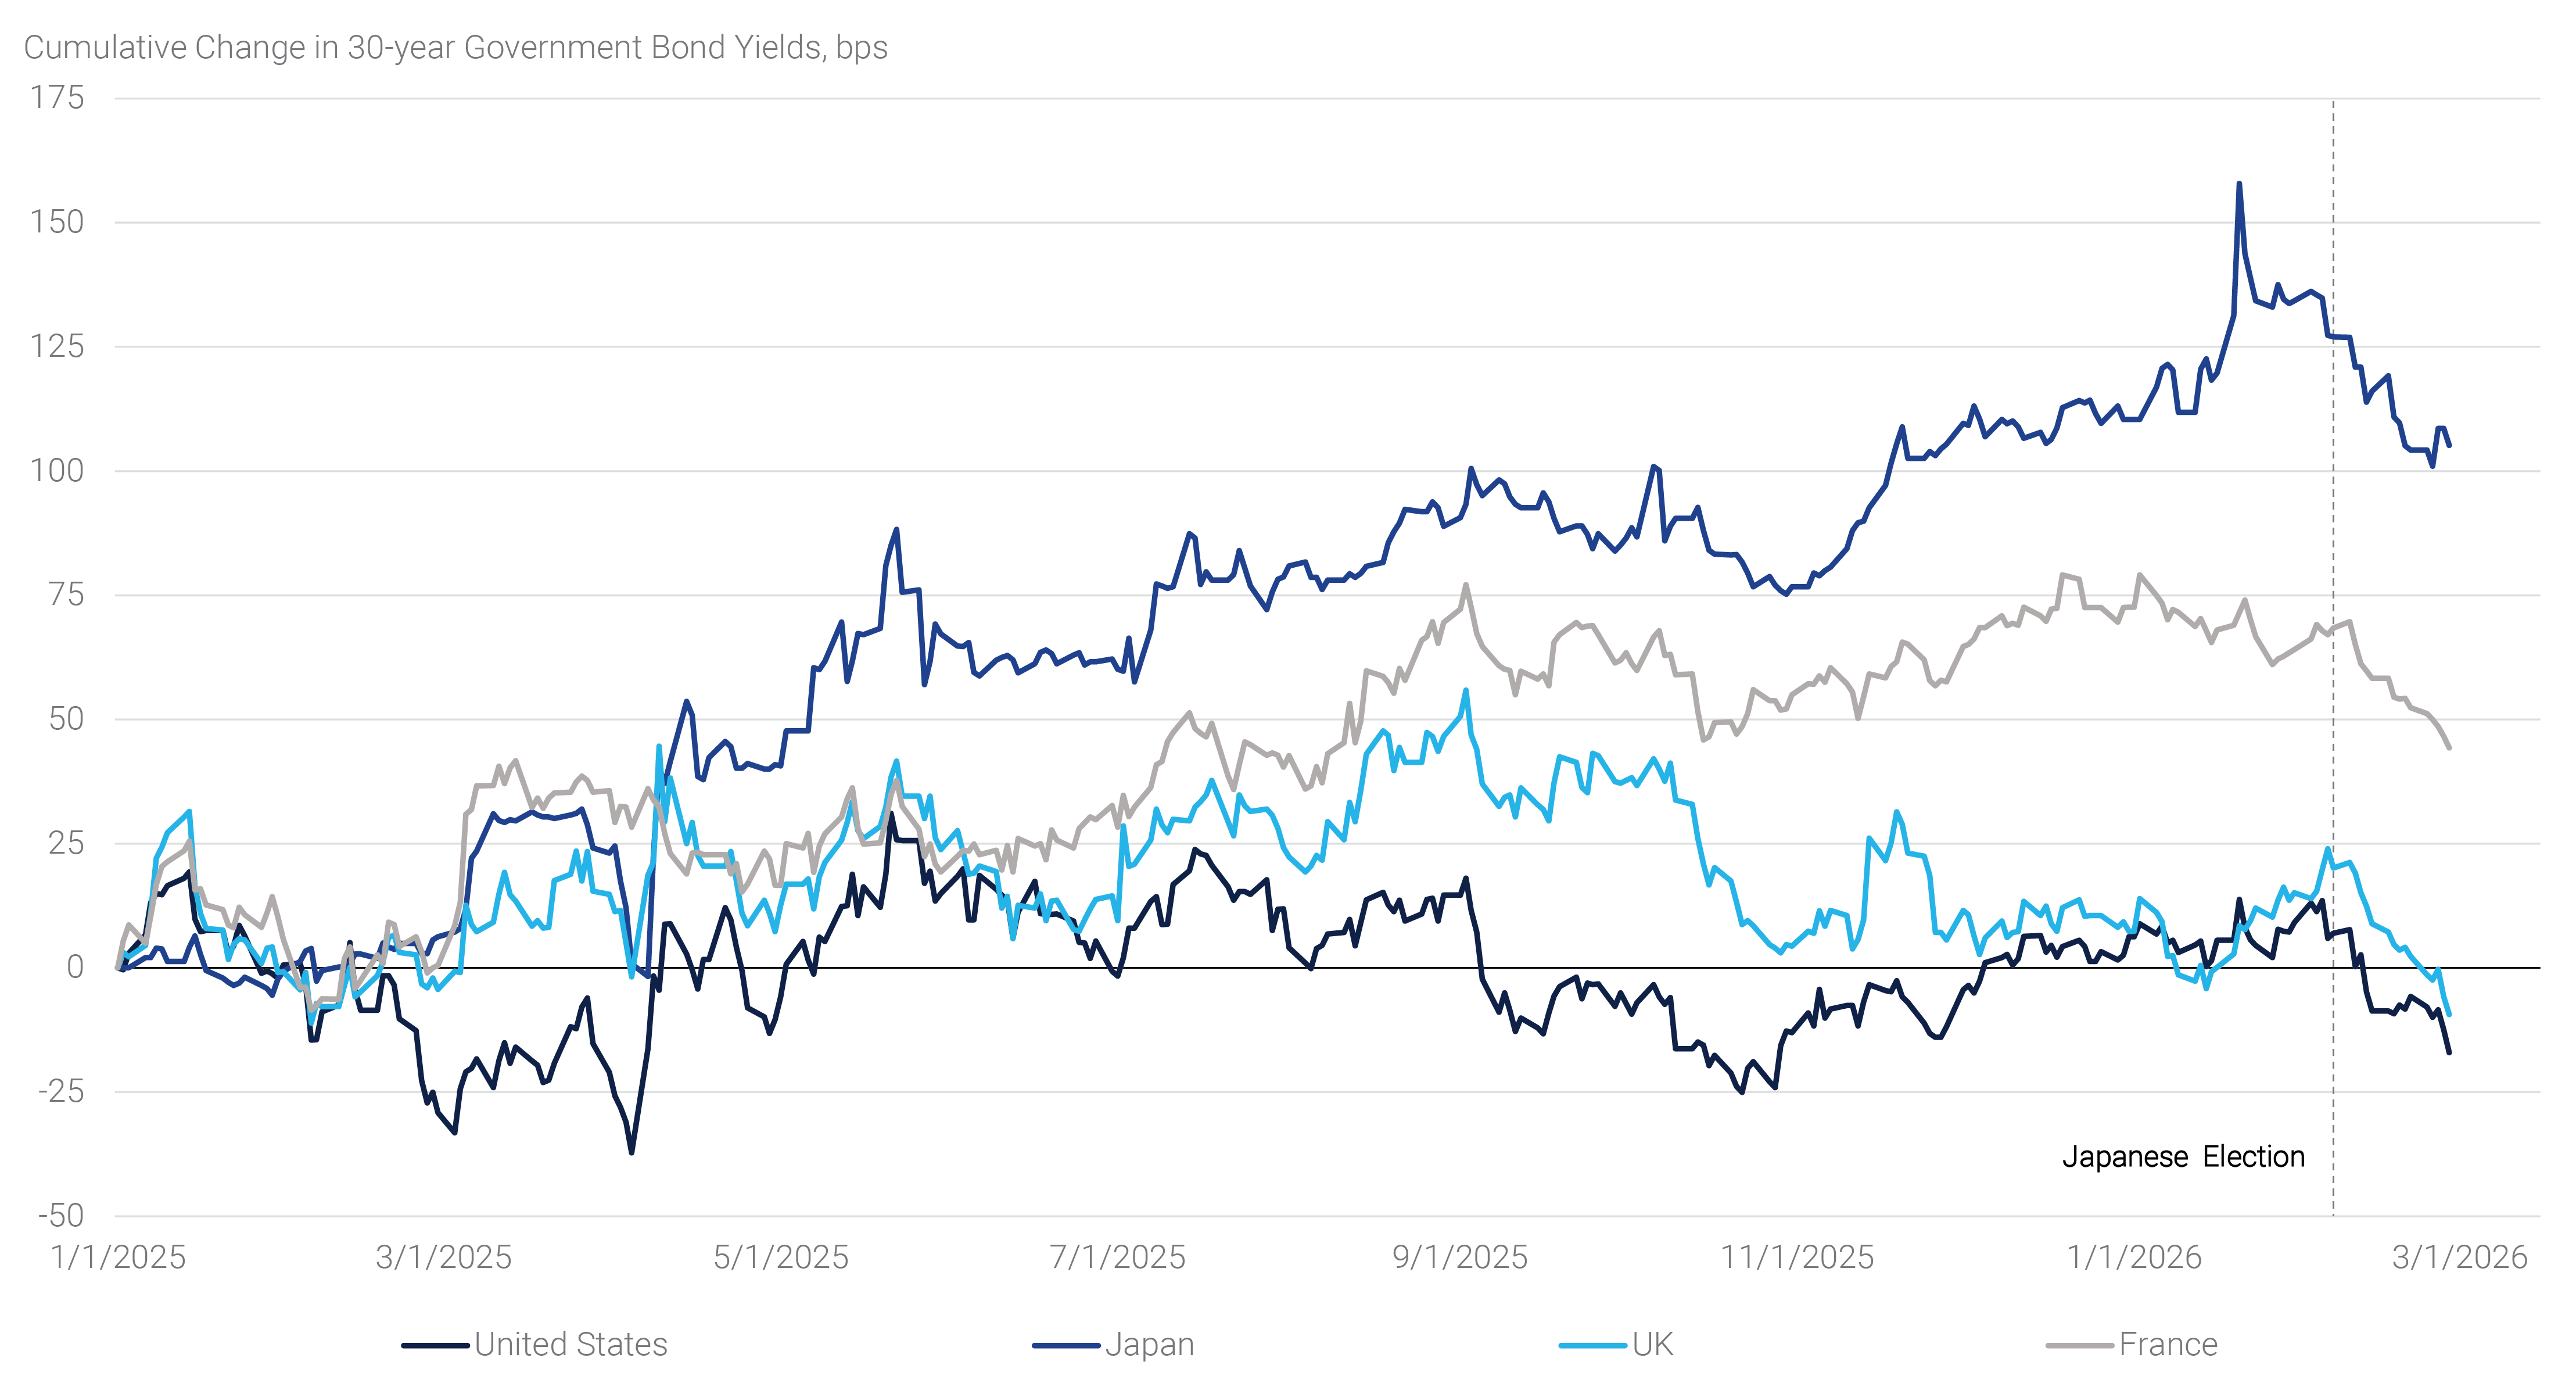
In light of these developments, Treasury yields rallied led by the long end, with the 2s10s yield curve flattening 15 basis points (“bps”) in February. The move ran counter to many steepening calls around the Fed Chair announcement and the IEEPA ruling. Yet, global factors, such as the aggressive flattening in overseas developed markets ultimately contributed to the price action in the U.S. In addition, a deterioration in risk sentiment and strong fixed income flows – which have averaged $20.5 billion per week according to Investment Company Institute data, roughly twice last year’s pace – have supported Treasury yields. With 10-year yields around 4%, long-term Treasuries could prove to be an attractive relative value proposition in a period of tight corporate bond spreads and high equity valuations. That said, recent developments have highlighted numerous crosscurrents.
Risk Assets and Agency MBS
Risk assets were mixed, with the S&P 500 delivering a negative 0.8% total return in the month, leaving the index modestly higher in 2026. Equity market volatility as measured by the VIX Index rose in February, though the aggregate market has remained relatively calm, helped in part by continued robust corporate earnings. However, individual sector performance diverged meaningfully as technology stocks came under pressure given rising concerns around AI disruption. Software stocks continued to underperform the aggregate market meaningfully, while investors are growing increasingly concerned about the hyperscalers’ larger capital expenditure guidance. At a negative 3.8% total return in February, financial services were the weakest sector, hit by a combination of concerns about private credit and the ongoing weakness in the crypto market.
Following January’s $200 billion GSE purchase announcement, Agency MBS spreads were mixed across the coupon stack, though the aggregate Bloomberg U.S. MBS Index delivered a modestly negative excess return of negative 0.08% on the month. The index benefitted from its composition mirroring the broader MBS universe, as lower coupons outperformed higher ones on reduced policy and refinancing risks. Although the Administration did not offer the widely anticipated housing policy initiatives in February, mortgage investors continued to worry about the impact of those announcements on tight mortgage valuations. While there was no new information regarding the GSEs’ purchase strategy, we expect mortgage spreads to remain well-supported in the near term given muted interest rate volatility and strong fixed income flows.
The U.S. Economy
Data received in February reinforced the economic resilience narrative we have seen play out in recent months. Despite a headline print below expectations, the Bureau of Economic Analysis’ (“BEA”) advance estimate of Q4 2025 gross domestic product (“GDP”) showed that the underlying growth trend was little changed with private sector consumption and investment tracking the three-year trend. Employment data suggest that the risk of rapid labor market deterioration has receded, while inflation remained roughly one percentage point above the Fed’s target for another calendar year. Given this backdrop, we expect that the Fed will hold rates steady until inflation cools more decisively, particularly given the recent uptick in oil prices due to geopolitical tensions.
Economic Growth
Real GDP increased at a 1.4% seasonally adjusted annualized rate (“SAAR”) in Q4 and 2.2% year-over-year (“yoy”) in 2025. While the former came in at half the consensus estimate and the latter represented the slowest annual growth rate since 2020, under the hood, the details were positive. Real final sales to private domestic purchasers rose at a 2.4% SAAR anchored by consumer spending (2.4% SAAR & 2.2% yoy) and investment (3.8% SAAR & 2.5% yoy). Consumption contributed 1.6 percentage points to Q4 GDP growth while investment added another 0.7 percentage points despite ongoing weakness in residential investments.
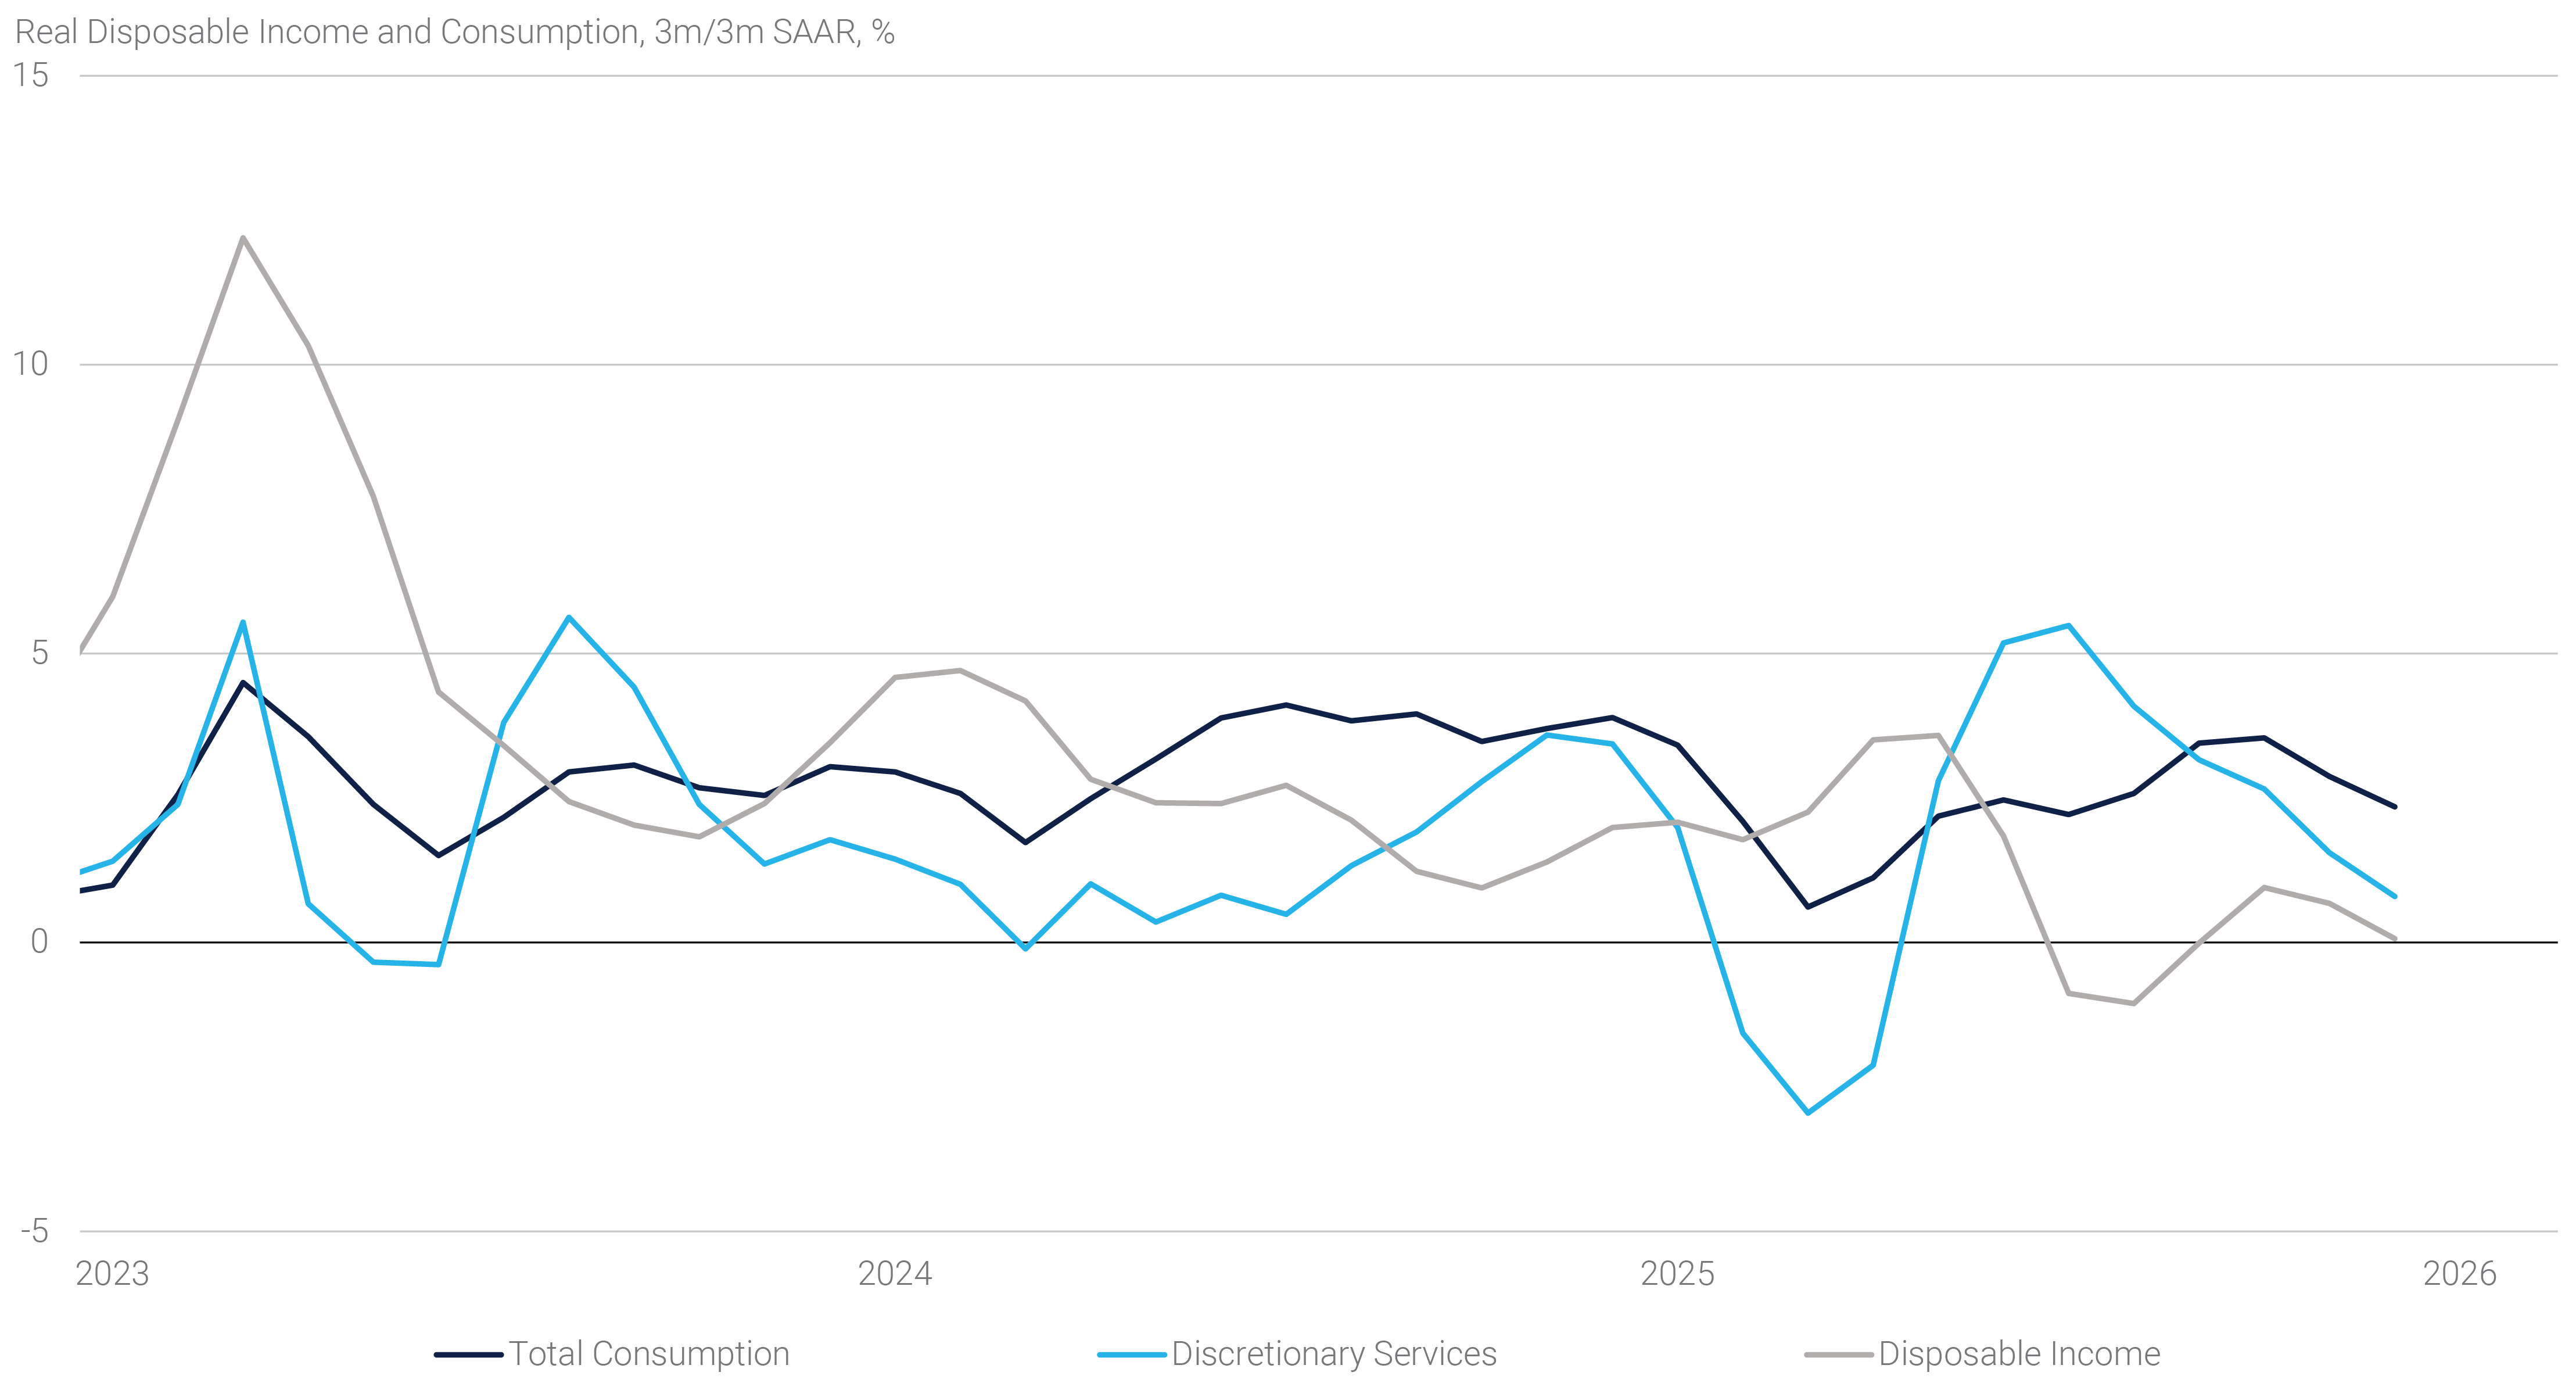
Services spending drove consumption (3.4% SAAR), while goods spending slipped (-0.1% SAAR) driven by durable goods. Looking ahead, higher-income consumers should continue to drive spending in the near term given still robust wealth effects and expected solid tax refund season. However, relative weakness in discretionary services spending and flat real disposable incomes, as seen in the December personal consumption expenditures (“PCE”) report, signal stress for some consumers (see panel 3). Tech investment was robust with equipment and intellectual property up 3.2% and 7.4% SAAR, respectively. Altogether, we estimate that tech investment accounted for roughly 60% of Q4 GDP growth. Of note, December industrial production hinted that capital expenditure is broadening beyond AI, a positive development for 2026 growth prospects.
Panel 3:
Discretionary Spending Slows(2) with Disposable Income
On the other hand, federal government spending was the main source of weakness, as the combination of the government shutdown and employment cuts subtracted 1.2 percentage points from Q4 GDP. Finally, the change in the trade balance essentially had no impact on growth for the first time this year. According to the U.S. Department of Commerce, the 2025 trade deficit (-$70.3 billion) was essentially at the same level as in 2024 despite all the tariff headlines.(3)
Labor Market
According to the Bureau of Labor Statistics (“BLS”), employers hired 130k workers in January, the highest monthly gain since December 2024. With modest revisions to prior months’ data (-17k), the 3-month average pace of total job growth rose to 73k – likely above replacement hiring at current reduced immigration flows. The unemployment rate declined to 4.3% and now stands near the top end of the range that most Fed officials consider to be consistent with "full employment.” Job growth remains highly concentrated with robust job creation in healthcare-related sectors while other sectors continue to struggle. That said, with recent monthly data showing that the trend in hiring has firmed since the summer, the January report suggests stabilization rather than deterioration.
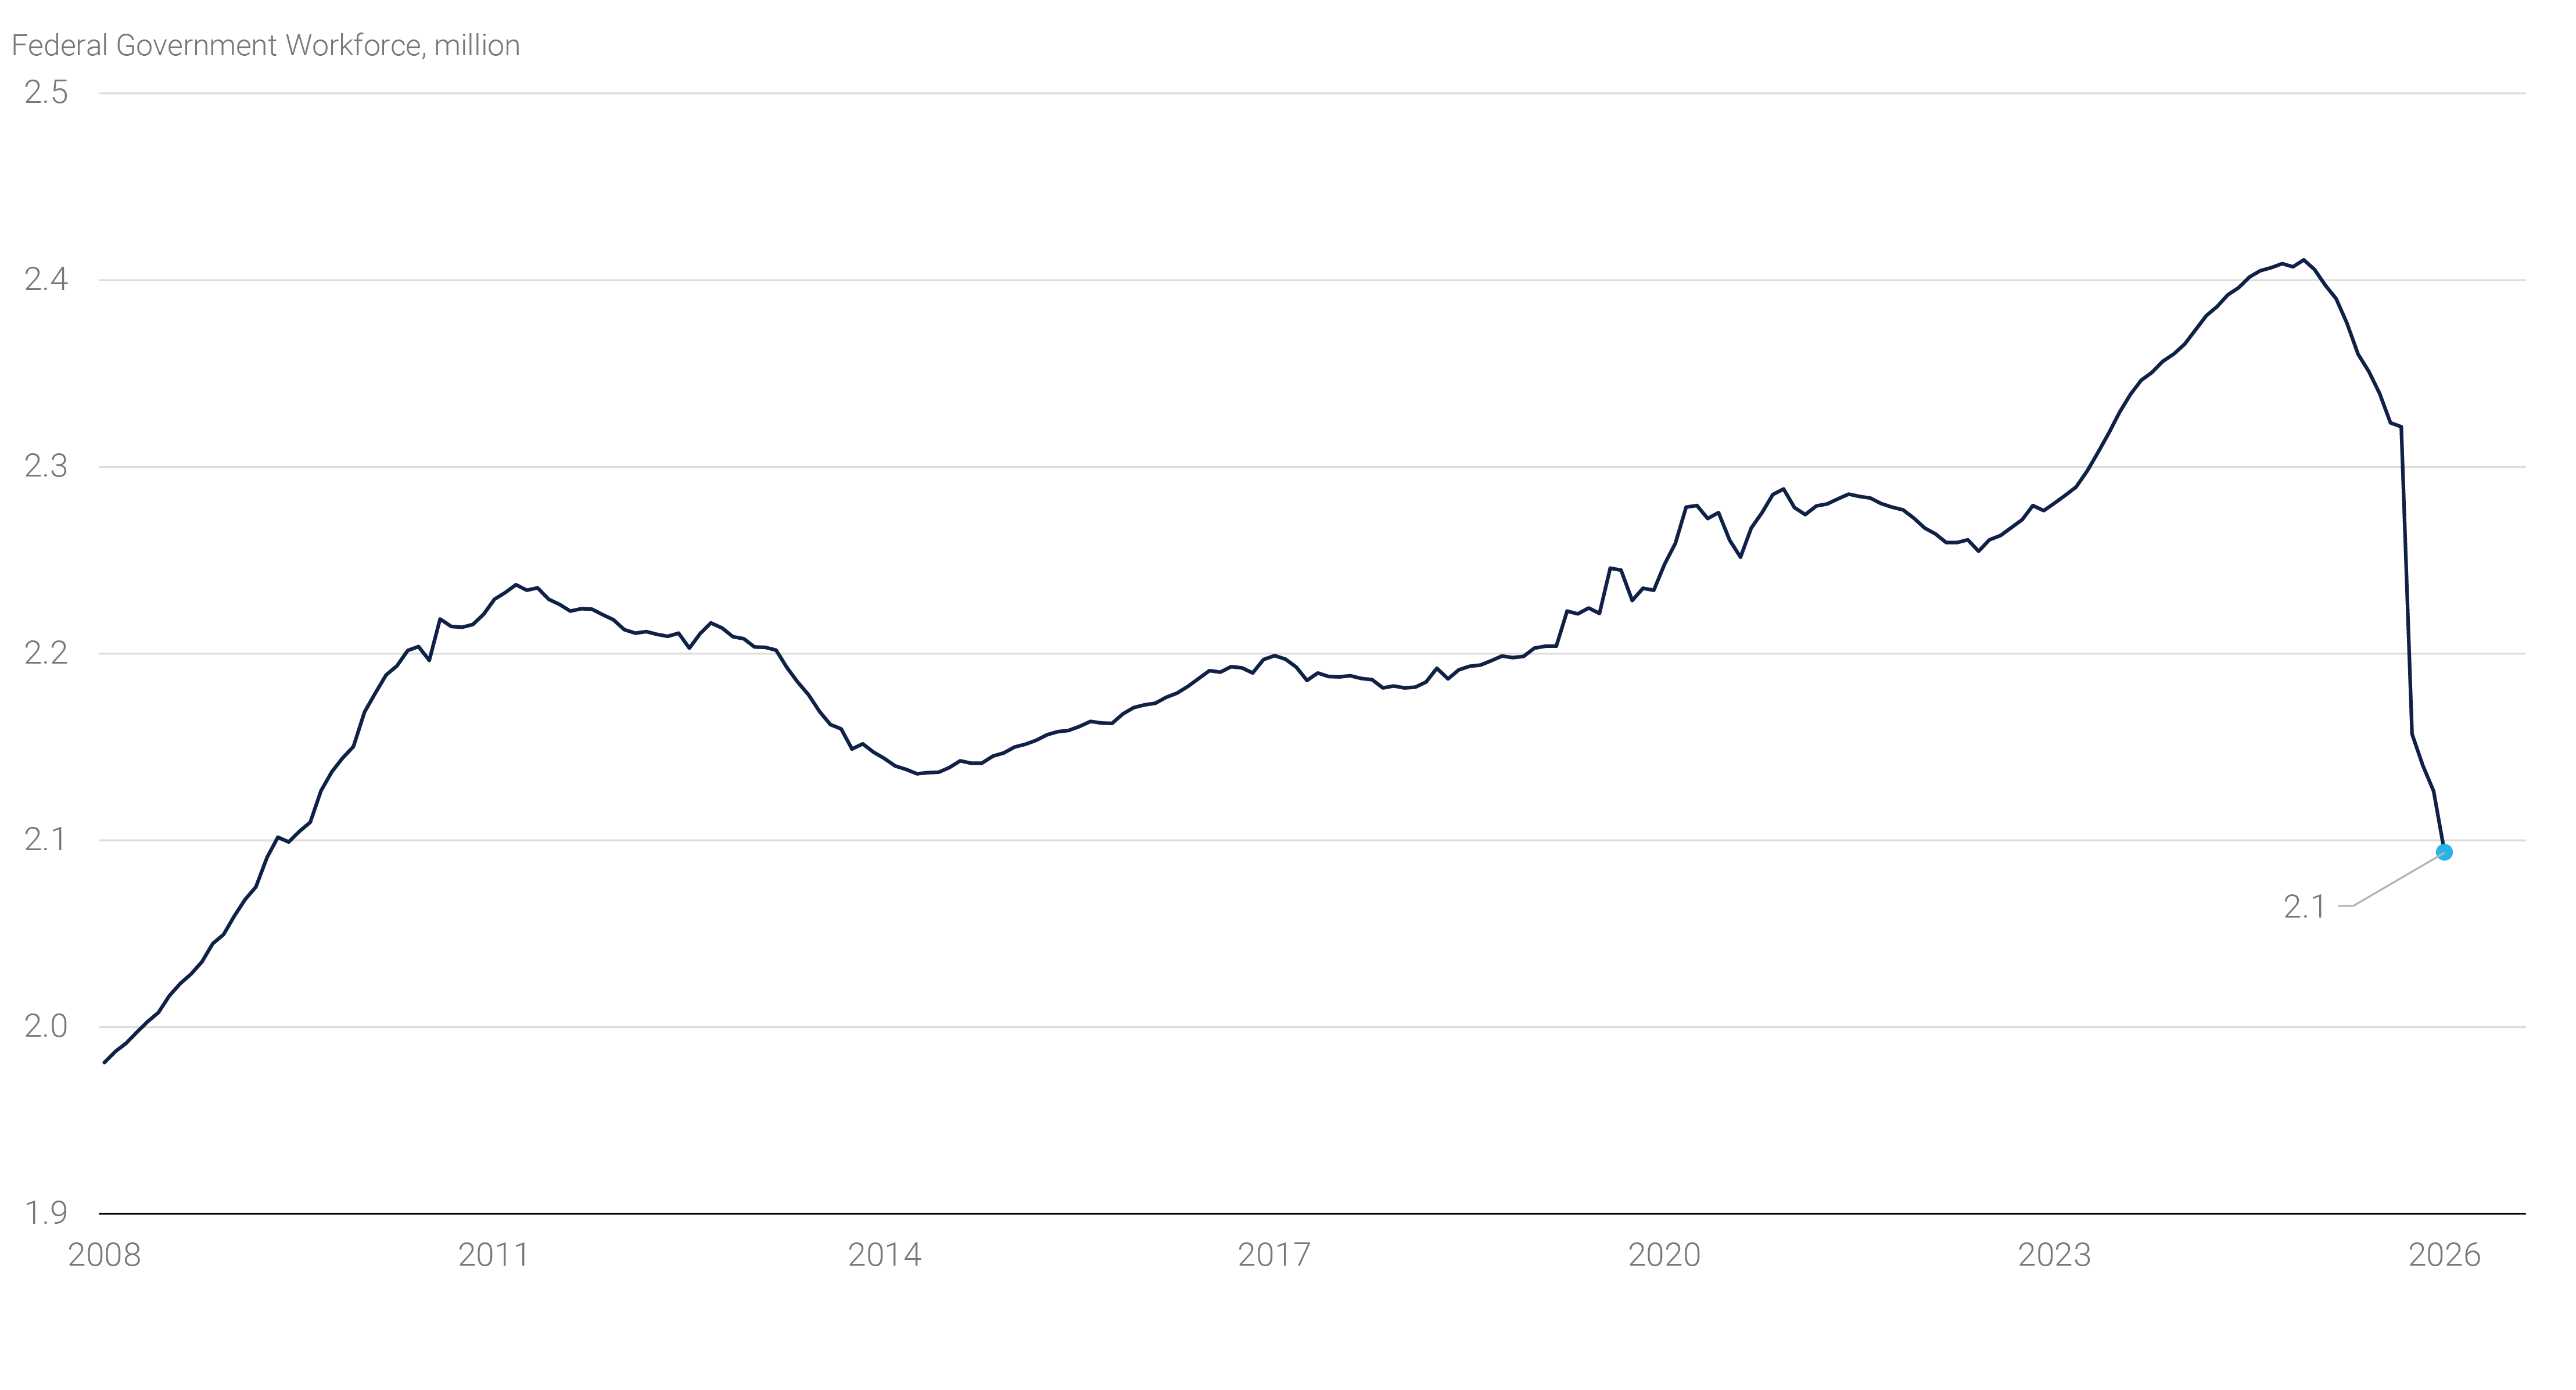
The annual benchmark revisions for the April 2024 – March 2025 period lowered payrolls by 861k jobs, the largest annual downward revision since 2009. Separately, the Trump Administration’s effort to reduce the federal government’s footprint has thus far resulted in a loss of 317k jobs and has brought federal government employment to the lowest level in more than 15 years (see panel 4). Additional revisions(4) lowered the total number of jobs created in 2025 from 584k to 181k, the slowest non-recession annual growth in employment since 2003. The very large downward revisions highlight some of the challenges the BLS faces, namely that the participation rate in the establishment survey has dropped and that fewer new firms are agreeing to participate. This has overlapped with an upward bias for initial payroll estimates and increased questioning of the sample’s representativeness. Thus, we believe that January’s strength should be viewed cautiously.
Panel 4:
Federal Government Employment(5) at Lowest Level Since 2009
Meanwhile, employment costs eased. According to the Q4 employment cost index (“ECI”), labor costs rose 3.4% yoy, the slowest pace since Q1 2021, as wage growth continues to cool and high insurance costs weigh on benefits. Notably, the ECI trails average hourly earnings (“AHE”) in the employment report, which posted a solid 0.4% month-over-month (“mom”) and 3.7% yoy increase in January. However, the benchmark revisions also pared aggregate labor income growth in the first half of 2025, better aligning AHE and ECI. Thus, we believe that Fed officials should be pleased to see that workers are still experiencing real income gains, but that accounting for productivity growth in this cycle, labor costs should not be a hurdle for inflation to get back to target.
Inflation
The December PCE report showed that the Fed’s preferred inflation gauge rose 0.4% mom and ended 2025 at 3.0% yoy – another year of little to no progress on the inflation front for the Fed. Relatively firm consumer and producer inflation reports for the month of January suggest that inflationary pressures continue to percolate. Looking at the Consumer Price Index (“CPI”), the core index (0.3% mom) was in line with expectations given a significant boost from core services that was offset by a drag from used cars. That said, the large drop in used car prices masked high prices in many other categories. Of note, shelter inflation continued to moderate which in turn should continue to drive the CPI-PCE divergence. On the Producer Price Index front, the much higher than expected core print (0.8% mom) was driven by gains in services costs, particularly trade services that have now more than fully reversed the margins squeeze seen in the second half of 2025. Notably, food and energy prices were subdued in both the consumer and producer inflation indices. Looking ahead, it appears inflation is likely to remain sticky in the near term.