April represented the second month in which the ongoing conflict in the Middle East dominated markets. A pause in active military attacks through a ceasefire announced on April 8, 2026, improved market sentiment and contributed to strong risk asset performance. Despite the pause in hostilities, the Strait of Hormuz continues to see limited shipping traffic with both Iran and the U.S. blocking traffic, which has led to global commodity shortages and elevated inflationary pressures. For example, average U.S. national retail gasoline and diesel prices through the end of April remained nearly 37% higher than at the onset of the conflict. Thus, April served as a period of follow-through from the initial repricing shocks as markets appeared to adjust to persistently higher energy prices and a Fed that signals patience – and perhaps more importantly – an increase chance that the next change to the Fed Funds rate is a hike, rather than a cut (i.e., two-sided policy risk).
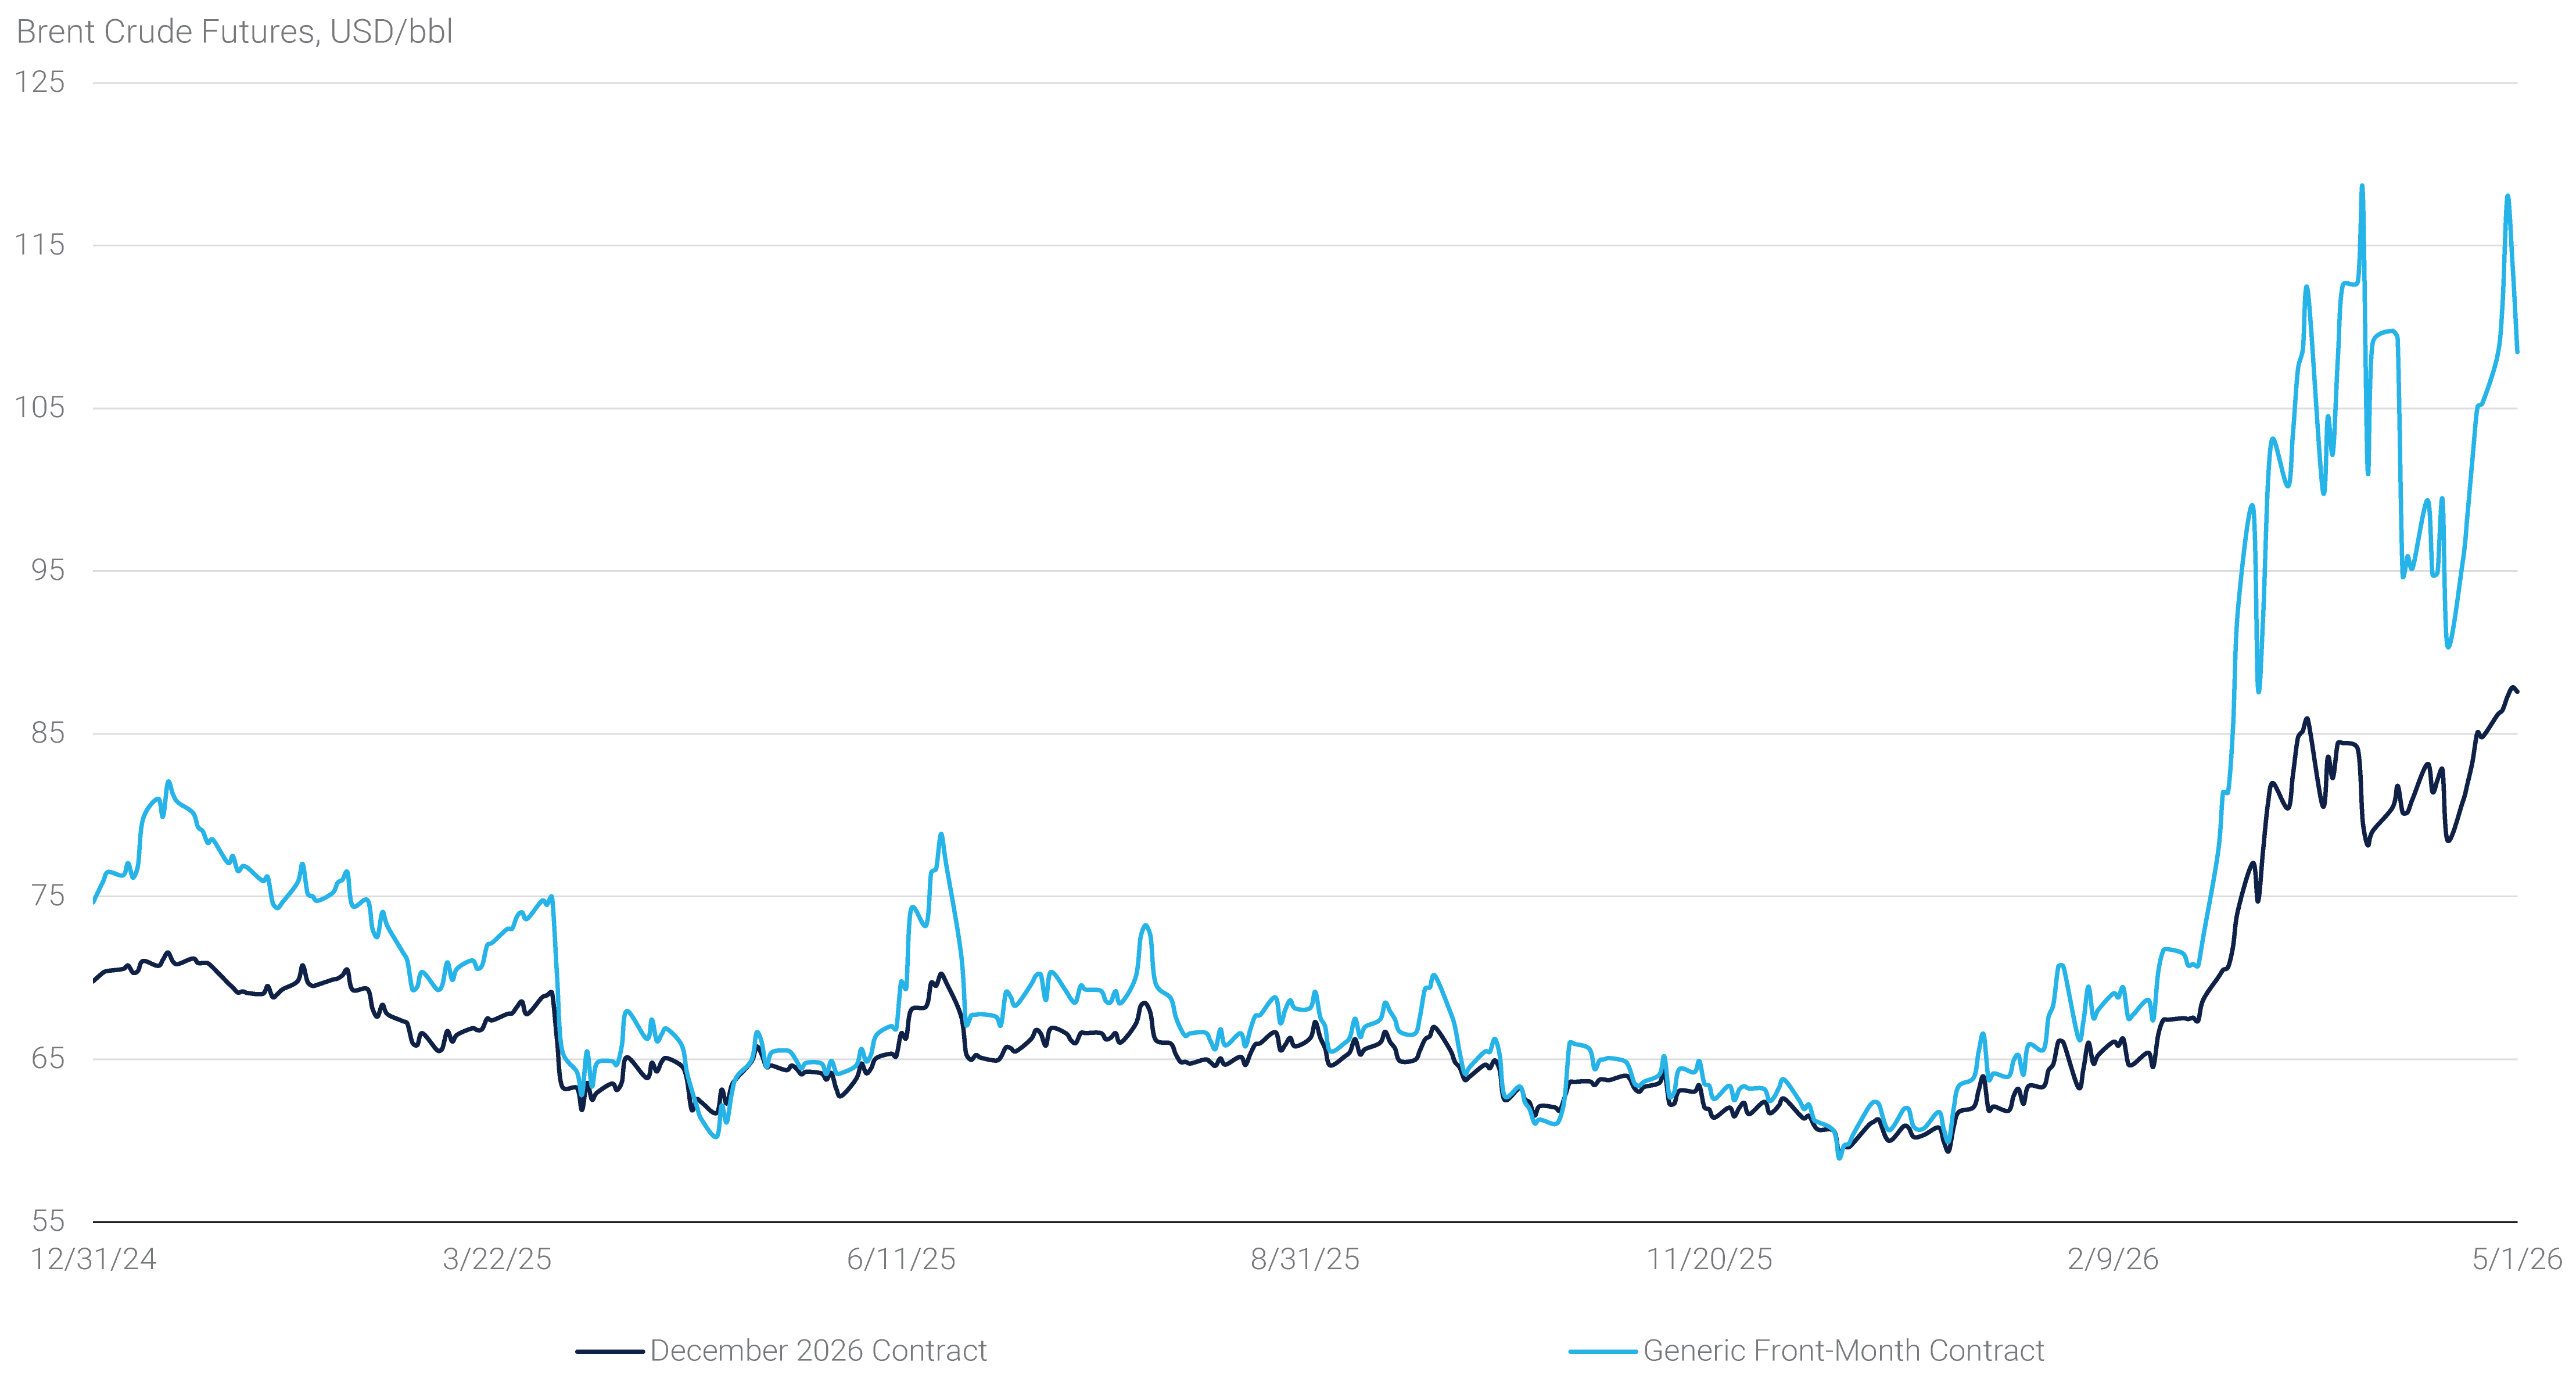
In light of these developments, oil prices continued to anchor the macro narrative. After the sharp rally in March, crude prices remained range-bound at elevated levels and highly sensitive to news headlines in April. The more interesting signal came from the forward curve, as markets remained in steep backwardation, pointing to meaningful near-term supply tightness. Front-month Brent traded in the low-$110s with prices declining into the mid-$80s by early 2027. At the same time, the entire crude oil futures curve shifted higher. Both Brent and WTI December 2026 contracts rose by roughly 10% from the end of March to the end of April, indicating the market is now pricing a higher floor for oil even as it still expects some normalization from current levels (see panel 1). Taken together, this suggests the shock is no longer viewed as purely transitory but rather reflects a reassessment of the broader supply-demand balance with structurally tighter conditions likely to persist beyond the immediate conflict. This dynamic has fed directly into inflation expectations and, in turn, interest rate markets.
Panel 1:
Oil Prices Remain Elevated
Interest Rate Markets
In fixed income markets, April brought a reduction in volatility though not a change in trajectory. Treasury yields remained elevated and drifted modestly higher, though within tighter ranges as the market transitioned from repricing to consolidation. At the core of the move was a continued repricing of the policy path. The Fed left rates unchanged at the April Federal Open Market Committee (“FOMC”) meeting, but communication reinforced limited need to ease amid a stickier inflation backdrop and increasingly two-sided risks. Markets pushed out the timing of rate cuts further, with minimal easing expected over the next year and a low probability of rate hikes emerging by mid-2027.
Against that backdrop, front-end yields led the move higher, with 2-year rates seeing their largest move following the FOMC meeting. Further out the curve, increases were more contained, resulting in continued curve flattening. The 10-year yield briefly breached 4.50% intra-month, its highest level since mid-2025, while the 30-year traded through the 5.0% yield mark. Overall, the move reflected inflation concerns expressed through the expected policy path rather than a material increase in longer-dated term premium.
Risk Assets and Agency MBS
Outside of Treasuries, the tone was constructive, as the lower level of volatility provided a more supportive backdrop for spread products. Mortgage-backed securities (“MBS”) performed well, with spread tightening led by higher coupons. The Bloomberg U.S. MBS Index delivered modestly positive excess returns of 0.13% in April. Agency MBS remained well-supported by robust supply and demand technicals and ongoing GSE purchases.(1) Credit markets also showed resilience, with both investment grade and high yield spreads tightening, retracing much of the March widening, and the Bloomberg U.S. Corporate Index delivering an excess return of 0.77% in April.
Equity markets benefitted the most from the more constructive backdrop as the S&P 500 rose 10.5% in April, marking its best monthly performance in several years, while the Nasdaq gained 15.3%, its strongest monthly total return since 2002. Technology stocks led the advance as another strong earnings season and continued enthusiasm for AI-related investment themes outweighed lingering concerns around geopolitics, inflation, and higher interest rates.
The U.S. Economy
Data received in April suggests that U.S. economic activity has been resilient despite the ongoing conflict in the Middle East. The economy continues to expand at a near-trend pace, with Q1 GDP growth rebounding from Q4 2025. The labor market stabilized, with job growth uneven month to month but the unemployment rate holding near estimates of full employment since mid-2025. That said, inflation re‑accelerated driven by the aforementioned surge in oil prices and renewed price pressures in core measures, complicating the Fed’s path toward further easing.
Economic Growth
According to the initial estimate from the Bureau of Economic Analysis (“BEA”), the U.S. economy expanded by a 2.0% seasonally adjusted annualized growth rate (“SAAR”) in the first quarter of 2026, an improvement from the sluggish 0.5% SAAR achieved in Q4 2025. Real final sales to private domestic purchasers – economic activity by the domestic private sector – accelerated to 2.5% SAAR, suggesting that underlying aggregate demand remains intact even as headline growth remains vulnerable to shocks from more volatile components (see panel 2).
Panel 2:
The Underlying Growth Trend Remains Resilient
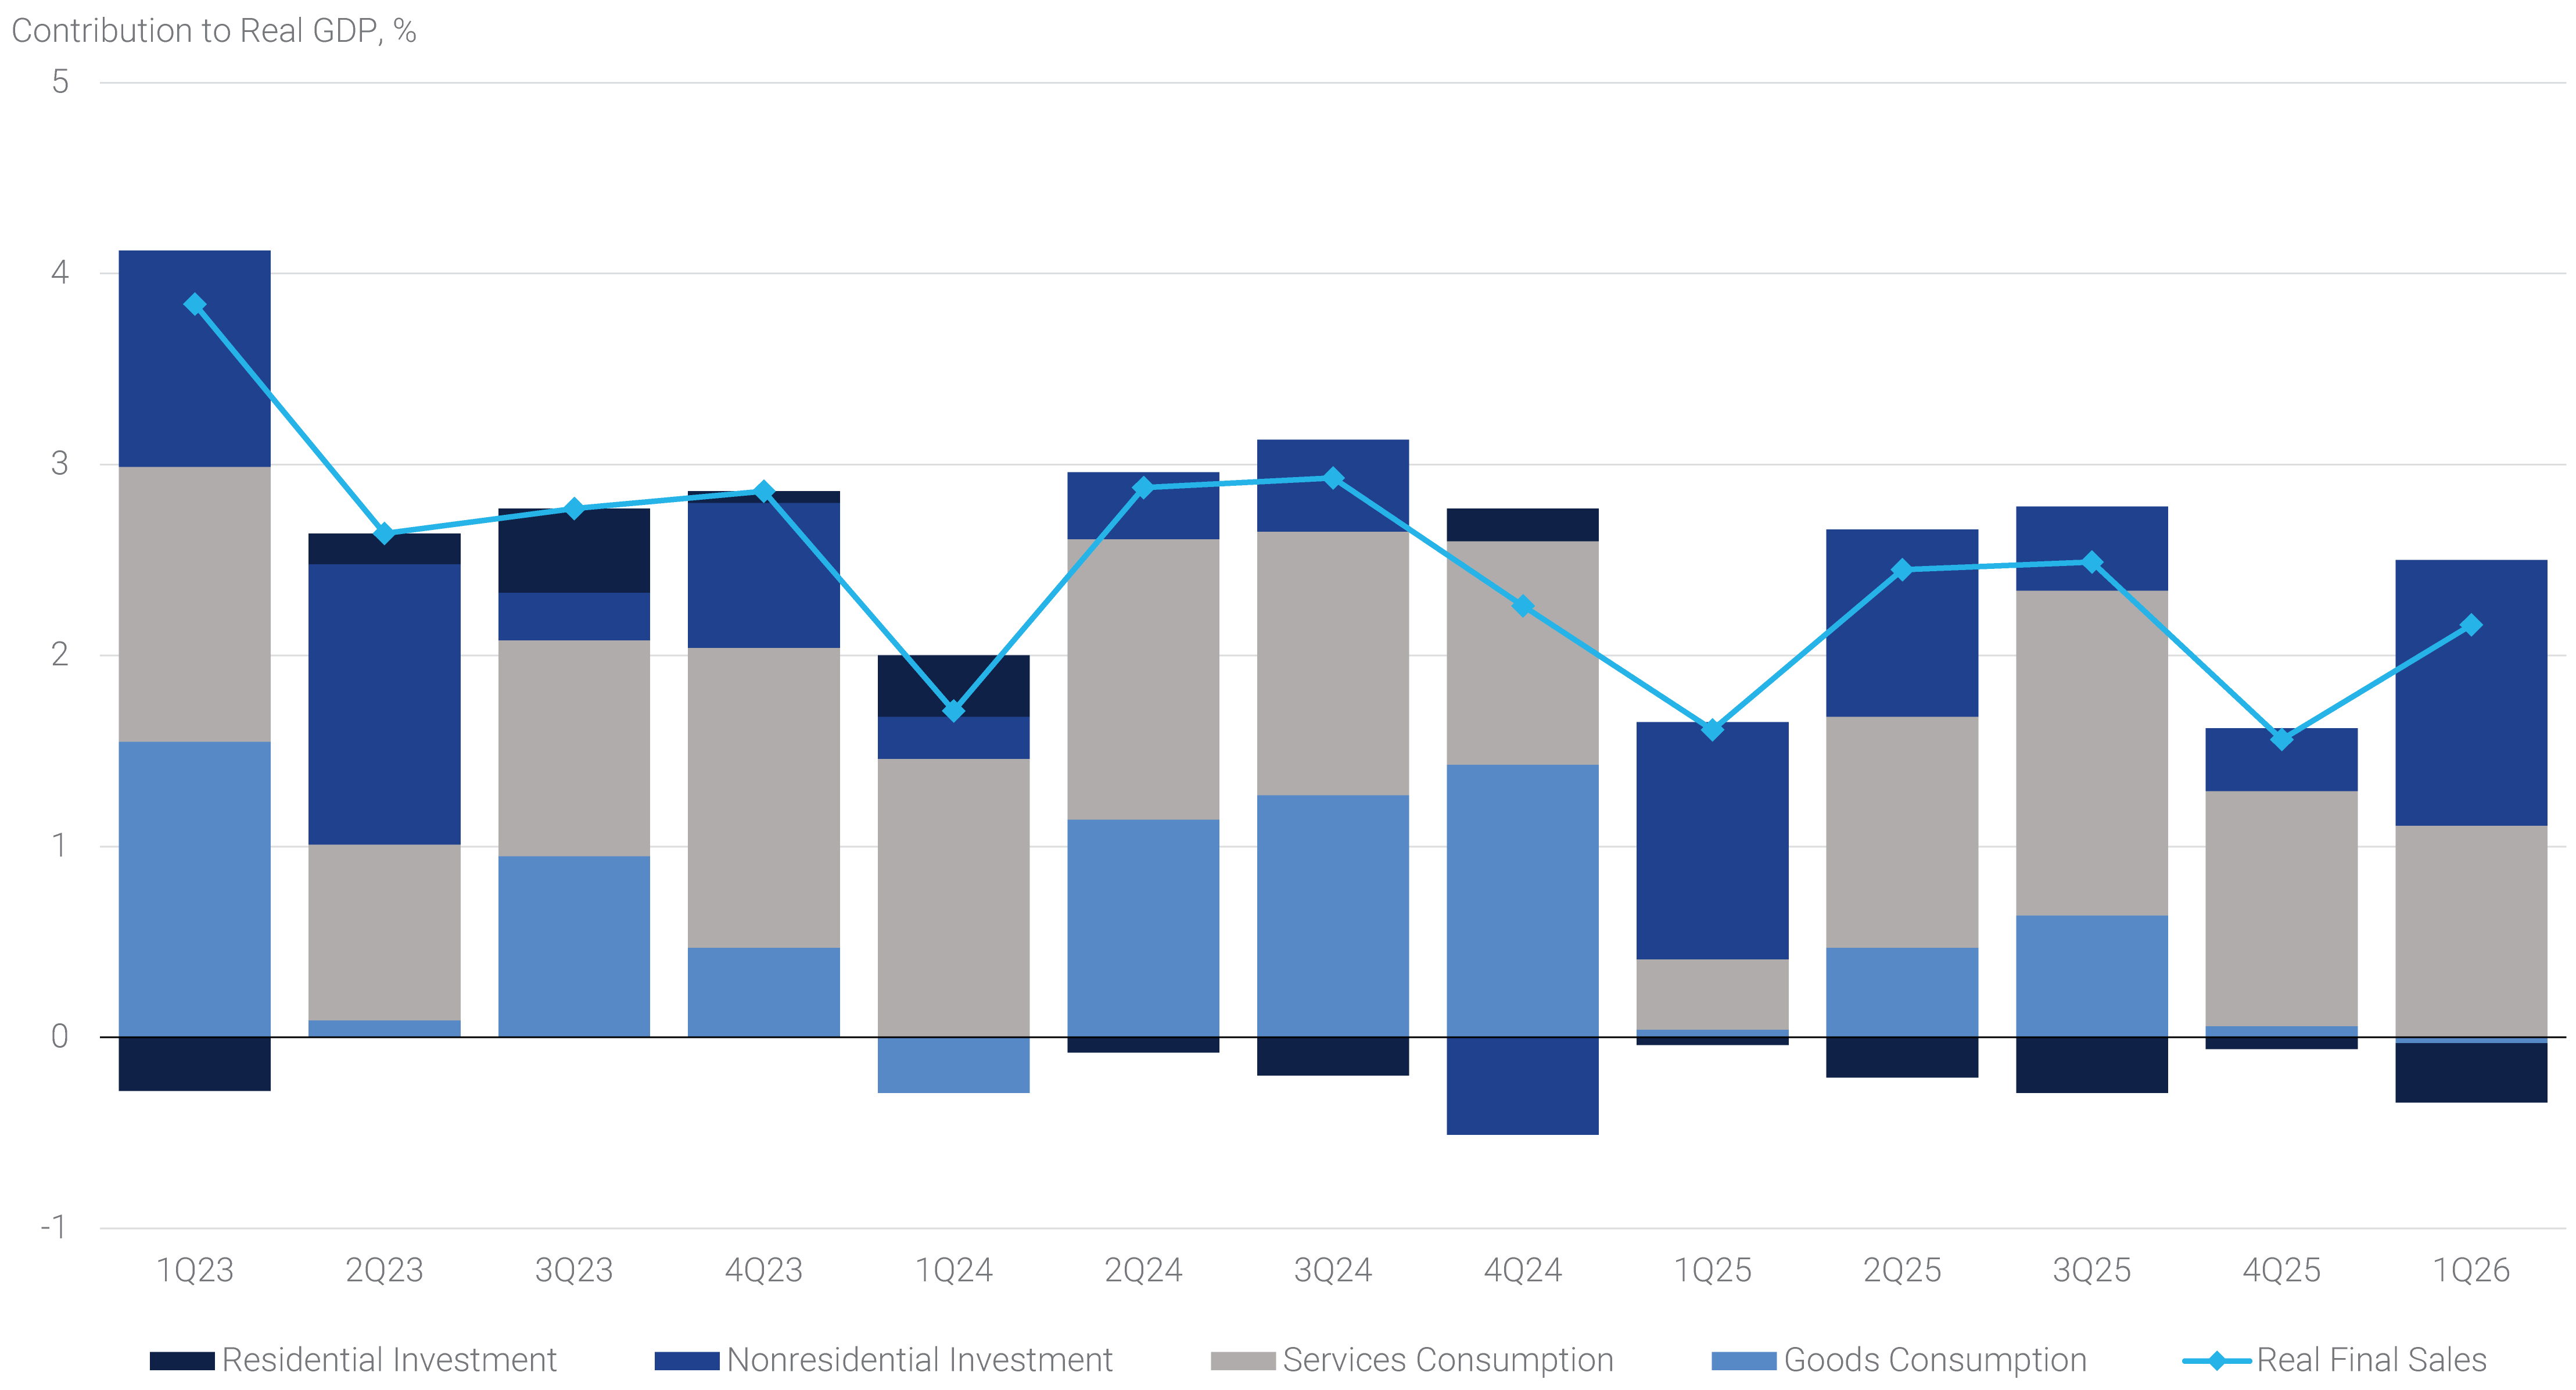
Private business investment was the standout contributor in Q1, rising 10.4% SAAR with particular strength in information processing equipment and software, underscoring the continued pace of capital deployment related to AI infrastructure and data centers. Federal government spending also rebounded sharply, rising 9.3% SAAR, reversing a sizable drag from the prior quarter. By contrast, consumer activity slowed. Real personal consumption expenditures (“PCE”) rose 1.6% SAAR, down from 2.6% in 2025, reflecting growing pressure on households from higher energy prices and elevated inflation more broadly. Additionally, net trade subtracted 1.3 percentage points from GDP growth. Overall, the GDP report painted a picture of a still‑solid economy, but one increasingly reliant on business investment, while consumer momentum moderated in light of slower income growth.
Inflation
April’s inflation data reinforced concerns that progress on disinflation has stalled or, more concerningly, that price pressures may be re-accelerating. The headline PCE price index rose 3.5% yoy in March, while core PCE increased 3.2% yoy, well above the Fed’s 2% target and the highest level since January 2024. On a quarterly basis, inflation jumped meaningfully, with the core PCE price index rising 4.3% SAAR in Q1. Energy prices were a key driver, reflecting geopolitical disruptions that pushed gasoline prices sharply higher late in the quarter. However, the firmness in underlying inflation metrics suggests that pressures are not limited to volatile categories. For example, core services inflation, excluding shelter, halted its disinflationary progress. Importantly, components feeding directly into the PCE calculation from both the consumer and producer price index reports were notably firm, reinforcing the notion that risks remain skewed to the upside.
Labor Market
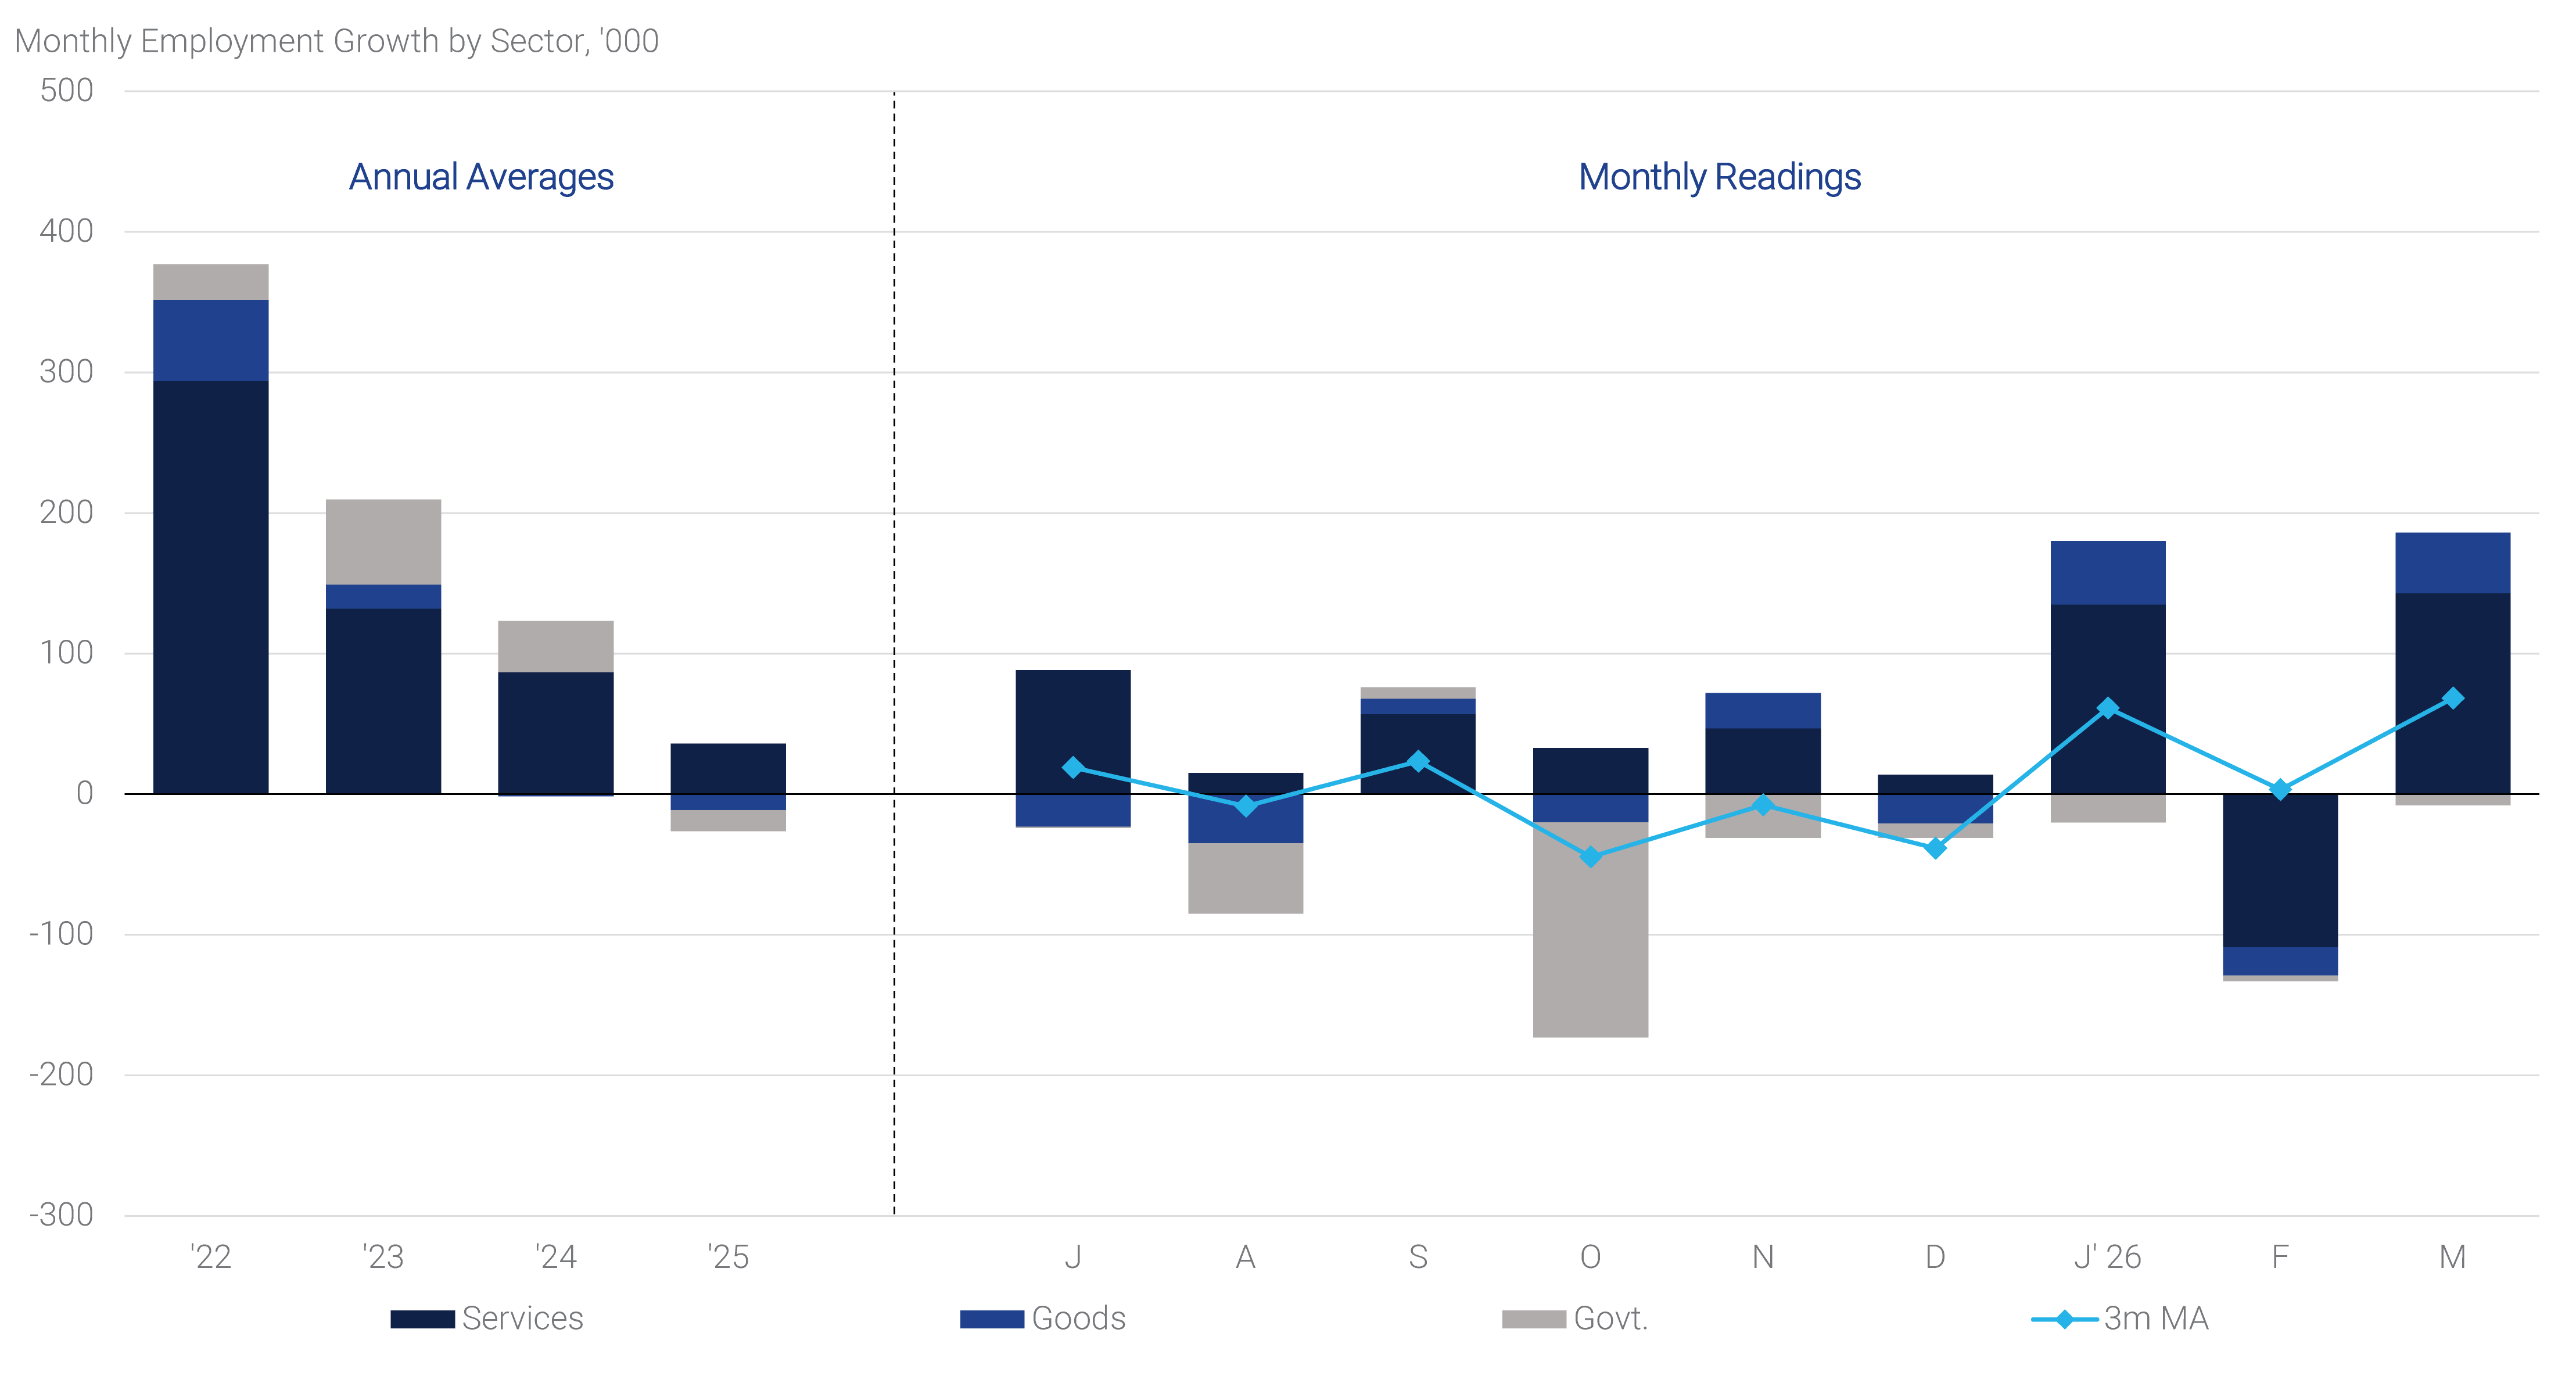
Data released in April highlighted the recent high volatility in payroll reports. Through that noise, however, it appears that activity in the labor market has stabilized though the pace of gains remains slow (see panel 3). According to the Bureau of Labor Statistics, nonfarm payrolls increased by 178,000 in March, reversing February’s weather‑ and strike‑distorted decline. While job creation was generally broad based, roughly half of all jobs gained were in the healthcare sector. Of note, employment in financial activities, professional services, and the federal government declined.
The unemployment rate edged down to 4.3%, though the improvement was driven in part by a further decline in labor force participation, which fell to 61.9%, its lowest level since late 2021. Wage pressures also continued to ease, with average hourly earnings rising 3.5% yoy, the slowest pace since 2021. Overall, while the labor market appears supportive of continued economic expansion, the combination of slower hiring, softer wage growth, and declining participation also suggests that conditions remain fragile.
Panel 3:
Despite Noise, Hiring Has Stabilized
Changing the Federal Reserve Playbook
The upcoming change in Fed leadership is an important milestone for the fixed income market. This past month, outgoing Fed Chair Powell held his final post-FOMC press conference and announced his intention to retain his seat as a Fed Governor, in part to see the conclusion to the investigations into the renovation of the Fed’s headquarters. Of note, the Department of Justice ended its criminal investigation, referring the matter to the Fed’s Inspector General, and allowing Kevin Warsh’s nomination to advance out of the Senate Banking Committee. We expect Warsh to be confirmed ahead of the next FOMC meeting and Powell to remain a Governor for several months, but refrain from commenting on monetary policy.
During his confirmation hearing, Warsh underscored his intention to position himself as an agent of institutional change at the Fed. He presented himself as reform minded and openly critical of the Fed’s post 2008 evolution,(2) repeatedly characterizing recent policy choices, such as the expanded Fed balance sheet, as examples of “mission creep” that contributed to the post-pandemic inflation surge. He also affirmed the importance of monetary policy independence but framed it in conditional terms, drawing a clear distinction between independence in interest rate decisions and other areas of Fed activity such as bank supervision, regulation, and fiduciary activity, where he argued independence should not apply.
In outlining potential changes under new leadership, prospective Chair Warsh criticized the Fed’s current communication strategy, arguing that officials speak too frequently and rely too heavily on forward guidance tools. He called for a “regime change” in communications, including skepticism toward the value of the Fed’s Summary of Economic Projections and the dot plot, which he suggested can lock policymakers into suboptimal decisions. Warsh also expressed openness to fewer or restructured press conferences and advocated for “messier” policy deliberations, including more visible disagreement and dissent within the FOMC, which he views as a necessary corrective to overly scripted consensus.
The central pillar of Warsh’s reform agenda is a substantially smaller Fed balance sheet. He argued that balance sheet expansion has been a form of mission creep and an inequitable policy tool that primarily benefits financial asset holders, in contrast to interest rate policy, which he views as more inclusive. Warsh stated his preference for a balance sheet that is smaller and shorter in duration over time, explicitly rejecting a long run role for holdings of long-term Treasuries and Agency MBS. While he emphasized that balance sheet adjustments would be gradual and deliberate, potentially coordinated with the Treasury, he was clear that reducing the balance sheet is essential for restoring policy flexibility and controlling inflation.
Recent months have brought increased debate as to what options would be available to the Fed to decrease its balance sheet. Most Fed officials appear to favor reducing banks’ demand for reserves through various measures(3) as the preferred option to shrink its balance sheet over time. One way to achieve this would be through changes in regulation that address the current incentive structure for banks to hold liquidity in excess of the liquidity coverage ratio (“LCR”). The LCR requires banks to meet deposit outflows over a period of 30 days with holdings of high-quality liquid assets (“HQLA”). While reserves represent the centerpiece of HQLA, banks are unlikely to use reserves during a liquidity stress event, fearing that this usage would lead to a shortfall in the LCR threshold. Instead, banks might opt to convert illiquid assets by using FHLB advances, which do not count as HQLA. Allowing such advances or the Fed’s lending facilities to count towards HQLA under certain circumstances might improve liquidity management and encourage usage of these facilities.
In addition, officials are looking at increasing the availability of Fed liquidity tools, such as the discount window and standing repo operations (“SRO”), to ensure they function more effectively as funding backstops in a time of need. Efforts include examining central clearing of the SRO to ensure broader participation and better functionality. Separately, reserve tiering – akin to a system that the European Central Bank has used – could also be an option, better aligning incentives for banks by compensating them the full interest on reserve balances (“IORB”) rate up to some established threshold and less beyond that threshold.(4)
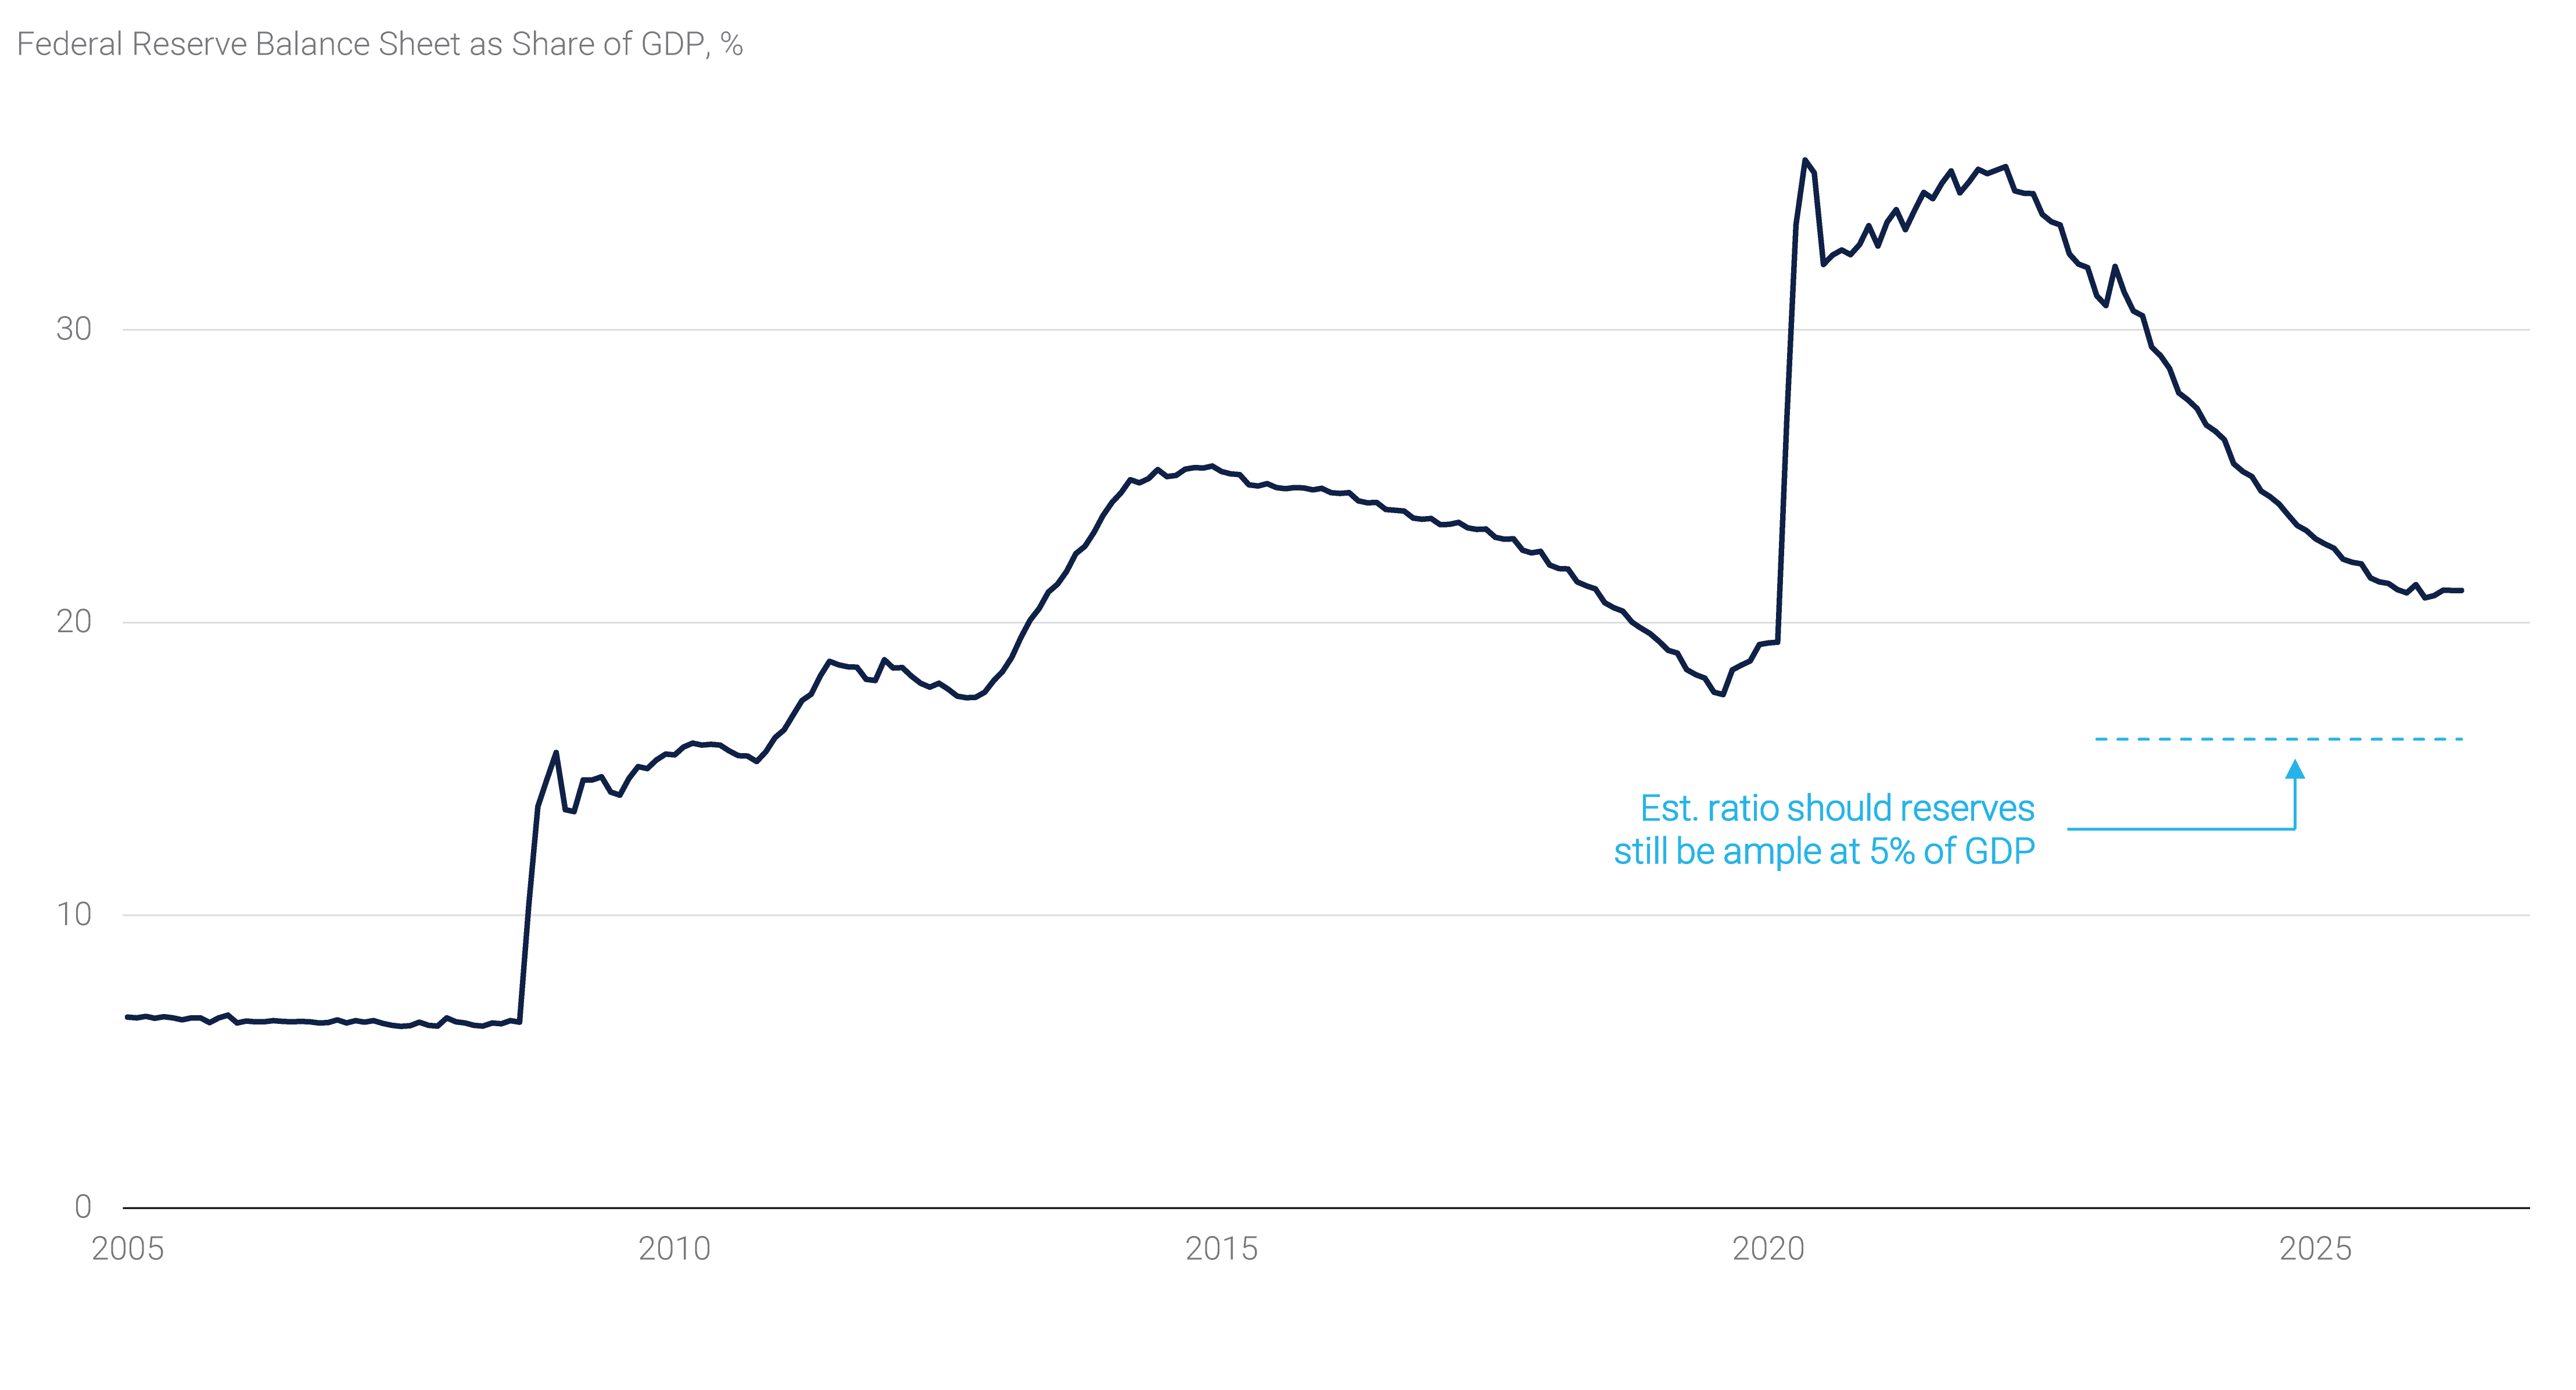
The options currently being examined would ultimately lower the threshold at which reserves become scarce or insufficient to provide for the seamless operation of the banking system. In the current cycle, the ratio of bank reserves to nominal GDP currently stands at 9.5%, leaving the aggregate Fed balance sheet at $6.7 trillion in size, or 21% of GDP, somewhat higher than the pre-pandemic balance sheet of 18% of GDP. As shown in Panel 4, reductions in reserve demand could impact the projected size of the Fed’s balance sheet. For example, if reserve demand does not change, the Fed’s balance sheet is assumed to grow roughly $370 billion through the end of 2027. If, however, changed regulations and improved operations could lower the threshold of “abundant” reserves to 5%, the Fed could shrink its balance sheet by roughly $1.2 trillion by then. That might seem small relative to the aggregate $2.3 trillion shrunk during the latest round of QT, but it would lower the balance sheet to its smallest size relative to GDP since 2010.
Panel 4:
Fed Balance Sheet Could Shrink Meaningfully Under Lower Reserve/GDP Ratios