.

Macro & Market Musings
June 2025

macro-market-musings07 Jul 2025

Key Findings

  • The U.S. economy is showing some signs of slowing, as May consumption data and revisions to first quarter gross domestic product (“GDP”) disappointed. It appears consumers are growing more cautious even as the labor market continues to hold up for now. Meanwhile, inflation continued to slow in May, driven largely by a moderation in services.
  • Financial markets responded to rising geopolitical risks in June, particularly related to the events in the Middle East, but ultimately ended the quarter on a positive note. Interest rates rallied in a steepening fashion as markets increasingly priced in higher odds of Federal Reserve (“Fed”) rate cuts over the next 18 months.
  • Given the recent U.S. Dollar weakness, markets have paid increased attention to foreign demand for U.S. securities. Thus far, there is little evidence of a meaningful shift in overseas U.S. securities holdings. 
 

The U.S. Economy

The narrative of U.S. economic resilience has held steady for most of the first half of the year with activity data generally coming in better-than-expected even as sentiment survey data has waned at times. However, the official start of the summer has not only brought sweltering temperatures but also a potential shift in the prevailing economic storyline. That is, the activity data have started to show some of the inhibiting effects of elevated policy uncertainty, even if inflation and labor market readings are holding up for now.

Economic Growth

According to the Bureau of Economic Analysis’ May Personal Consumption Expenditures (“PCE”) report, consumer spending fell 0.3% month-over-month (“mom”) in inflation-adjusted terms as the front-running of tariffs – primarily in durable goods – appears to have come to an end. Services sector consumption also slowed as consumers spent less on travel and restaurants, with the latter posting the weakest reading (-1.1% mom) since February 2023. The stepdown in consumption had been foreshadowed by a mixed May retail sales report and downward revisions to Q1 GDP growth. Driven by much slower services spending, Q1 GDP revisions revealed that consumer spending grew at a moderate 0.5% seasonally adjusted annualized growth rate (“SAAR”) and not at the 1.8% SAAR pace initially estimated.

While spending has improved in Q2(1) relative to the revised figures for Q1, the patterns revealed in the latest batch of spending data more closely align with the deterioration seen in the survey data for most of the first half of the year. Further complicating the spending picture, May disposable income fell sharply as payments associated with the Social Security Fairness Act subsided. Additionally, other passive income categories were weak as well – with proprietary, rental, and dividend incomes declining in May relative to April. That said, the weakness across all these categories is likely more of an anomaly than a new trend, suggesting the run rate of income is stronger than the May report suggests.

Altogether, the economic narrative continues to shift, and the notion of a relentless U.S. consumer is coming into question. Moreover, a confirmation of May’s weaker spending in the June data would both further lower the trend as well as raise questions about the extent to which consumption – the main driver of economic growth in recent years – is slowing.

Labor Market and Inflation

Turning to the labor market, the U.S. economy added 147,000 jobs in June according to the Bureau of Labor Statistics, roughly in line with the 3-month average pace of job growth. The report marked a fourth consecutive upside surprise in headline hiring relative to expectations, while the unemployment rate declined to 4.1%.

Of note, details of the June payrolls report were weaker than the headline suggested. However, meaningful changes to immigration policy may also alter the labor market’s supply and demand picture going forward. Even though hiring and labor demand send few warning signals, applications for unemployment benefits have risen to the highest levels in eight months. While these data tend to be volatile week-over-week, initial and continuing jobless claims indicate that it is increasingly difficult for job seekers to find new employment (see panel 1).

Panel 1:

Labor Market Might Be Holding Up, But It Is Getting Harder to Find a Job

With respect to inflation, May data showed muted pricing pressures and did not contain a meaningful uptick in tariff-related inflation. Core PCE inflation increased marginally to 2.7% year-over-year, but inflation momentum, as measured by the 3-month annualized pace of 1.7%, slowed meaningfully from last month. Of note, core PCE goods prices showed some modest early pressure from the tariffs in certain categories, such as household appliances and furniture, while core PCE services prices slowed. Recent inflation prints have highlighted a dynamic in which friendly services inflation prints could partially offset accelerating goods inflation, in turn keeping aggregate inflation below the currently forecasted pace in the second half of the year.(2) 

Financial Markets

Financial markets broadly delivered positive returns in June despite a backdrop of elevated geopolitical tensions, renewed fiscal concerns, and ongoing trade policy uncertainty. Risk assets outperformed, Treasury yields rallied, and investors priced in a more dovish path for Fed policy at times.

Federal Reserve and Interest Rates

Much of the month’s volatility was driven by headline risk. Geopolitical tensions, particularly the conflict in the Middle East, added to global uncertainty, with the most pronounced moves seen in the oil market — West Texas Intermediate crude oil briefly spiked as much as 20% mid-month. Domestically, investors contended with the implications of a sweeping tax and spending package advancing through Congress and ongoing concerns over tariff policy. Still, softer economic data and a subtle but notably dovish shift in tone from select Fed officials helped offset headline-driven anxiety, ultimately supporting market sentiment through month-end.


On the rates front, investor focus shifted firmly to the incoming data. At its June meeting, the Federal Open Market Committee (“FOMC”) maintained its data-dependent stance and updated its forecasts to reflect higher inflation and slower growth for both this year and next. Yet, a growing sense that reflationary risks have been overstated, alongside indications that the unemployment rate may be set to rise, has led markets to increase expectations for near-term easing despite broader calls for patience from Fed Chair Powell (see panel 2).

Panel 2:

Markets Shift to Greater Odds of Fed Easing by Year End

As a result, the Treasury curve bullishly steepened. The front end rallied sharply, with 2-year yields falling 18 basis points (“bps”) over the month and 32 bps from their post-May payrolls peak on June 6th. Overnight Index Swaps price a 17 bp cut by the September FOMC meeting, and approximately 96 bps of easing over the next 12 months, though expectations for the cycle’s terminal rate remain largely unchanged. Long-end yields also declined, although to a lesser extent, with the 10-year yield ending the quarter just below 4.25%, supported by a decline in market-based inflation expectations. Throughout the month, funding markets remained orderly supported by elevated money market liquidity in the wake of debt ceiling constraints. While there was modest quarter-end pressure, it was anticipated and short-lived.

Volatility and Risk Assets

Meanwhile, broader measures of interest rate volatility declined to multi-year lows, contributing to strong performance in spread assets. The Bloomberg U.S. MBS Index posted a 36-bp excess return, with intermediate coupons outperforming amid the rally. In credit markets, spreads continued to retrace the widening seen earlier in the year, and both investment grade and high yield credit posted gains. The Bloomberg U.S. Aggregate Corporate Bond Index recorded a 38-bp excess return on the month.


Equities continued to climb in June, supported by improved consumer sentiment and the easing rate expectations. The S&P 500 broke above its mid-February peak gaining 5.1% in June, fully recovering from the tariff-driven pullback earlier in the year. Mega-cap growth stocks led the rally, with the Bloomberg Magnificent 7 Index returning 6.1% for the month. While both stocks and bonds rallied, the U.S. Dollar weakened notably from a historically strong valuation, with the DXY Index down 2.4% in June and 10.8% year-to-date — its largest first-half decline since 1973.

What’s Up with Foreign Demand for U.S. Fixed Income Securities?

Amidst the trade war and tariff threats that dominated news headlines in the first half of 2025, financial markets have paid increased attention to the outlook for the U.S. Dollar and – closely related – foreign demand for U.S. bonds and stocks. The release of the Treasury International Capital (“TIC”) report for the month of April provided an initial checkpoint for market participants to judge whether foreigners are turning their back on U.S. securities. Following several years of very strong overseas demand – particularly for equities, as U.S. companies offered the most compelling returns – demand might slow this year. However, there are few signs that foreign investors are selling large amounts of U.S. securities thus far. 


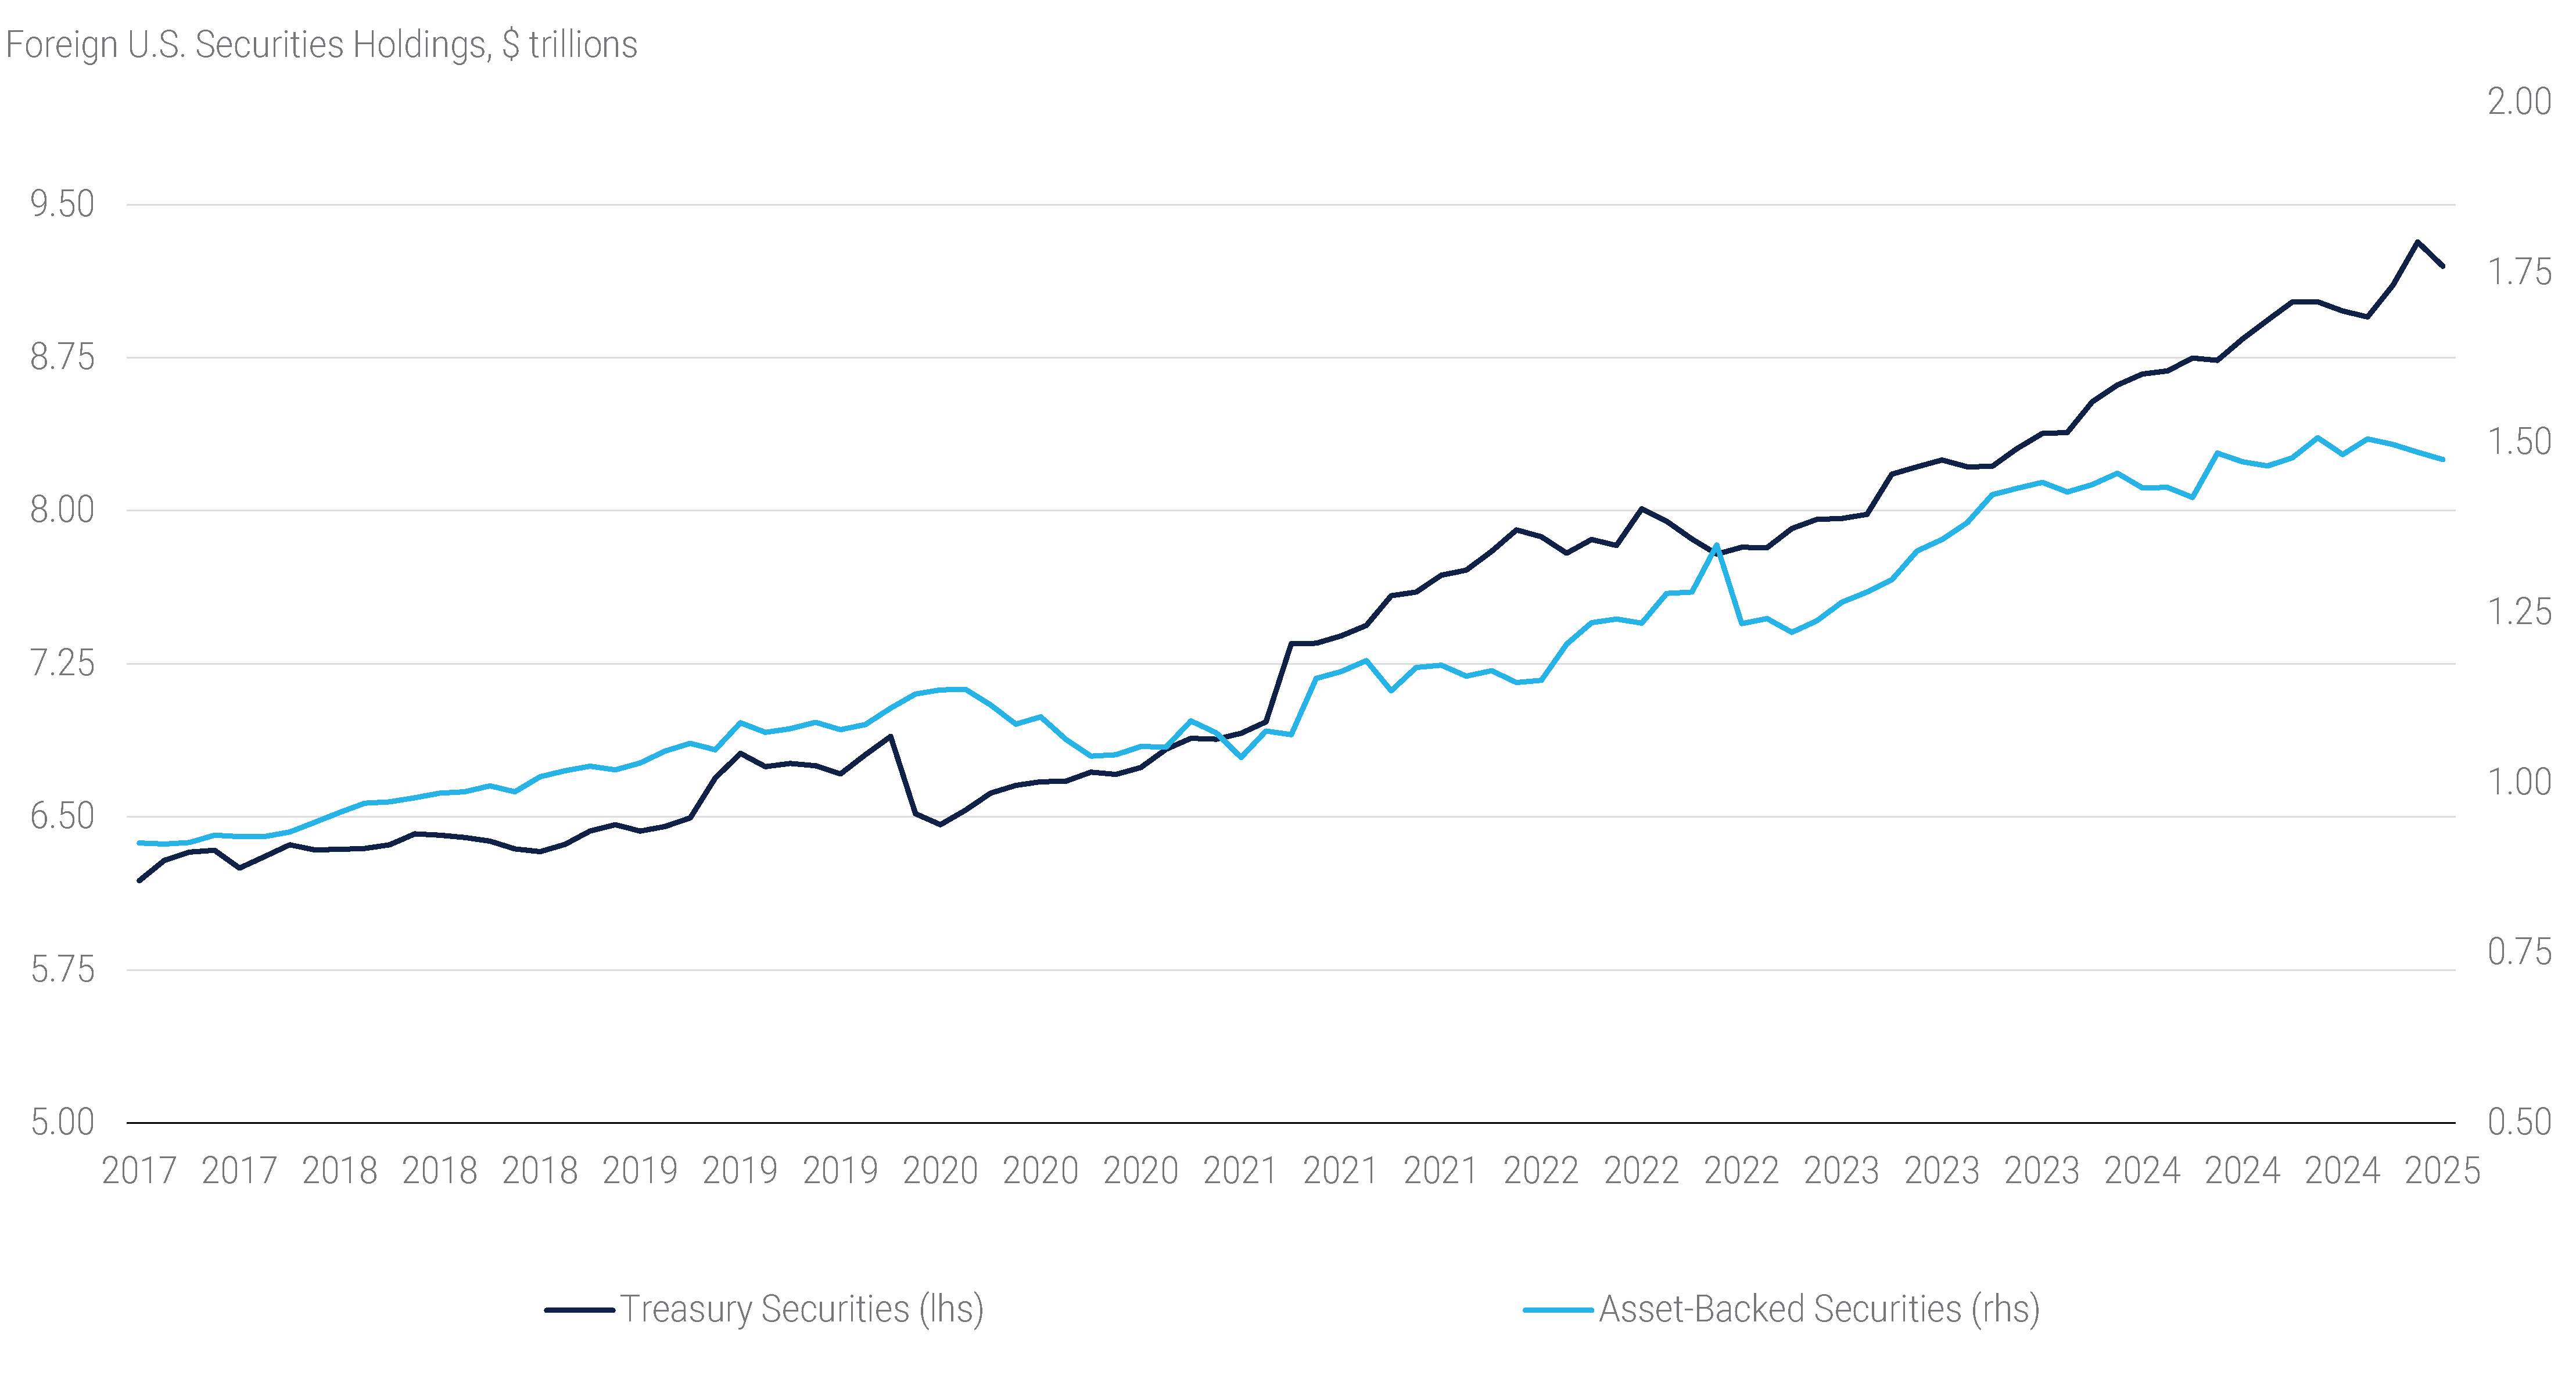
The April TIC report was perhaps the most widely anticipated report to gauge short-term foreign demand trends. The report tracks international transactions in and holdings of U.S. securities and showed some weakness in April, but ultimately did not change recent trends meaningfully. Foreigners sold an estimated $138 billion across Treasuries and Agency MBS,(3) the largest monthly holdings decline across the two categories since November 2022. While sizeable for a single month, the outflows were modest relative to the strong inflows earlier in 2025, as February and March saw an estimated $345 billion in combined purchases from foreigners. In addition, nearly half of the Treasury holdings decline came from Canada, which shed an estimated $63 billion during the month, but had also been the major buyer of Treasuries in February and March. Despite the April decline, the foreign holdings of Treasuries and Agency MBS remain near their all-time highs (see panel 3).


Panel 3:

Foreign Holdings of U.S. Income Securities Remain High

Outside of the monthly volatility, continued weakness from certain jurisdictions, like China and Japan, historically two of the largest holders of U.S. Treasury securities and Agency MBS, was arguably more notable. According to our estimates,(3) China and Japan have seen notable declines in their holdings over the past year, shedding an estimated $179 billion of Treasuries and Agency MBS combined. This represents roughly 7% of their combined holdings. While the declines are occurring simultaneously, they are likely driven by different motivations. For Japanese investors, rising FX hedging costs have made U.S. assets unattractive in recent years, likely leading them to let holdings mature, while reinvesting in better-yielding alternatives. In contrast, China has been actively altering its reserve management practices and has shifted towards third-party custodians. For example, it may be the worst kept secret among data watchers that increases in Belgian holdings of Treasuries have been driven by China shifting reserve holdings to European domiciled custodians such as Euroclear, in turn obfuscating the ultimate holding jurisdiction. Moreover, over the past year, holdings in Belgium have grown more than holdings in China have declined.

Meanwhile, foreign account participation at Treasury auctions has slowed in recent years. Treasury auction participation data paints a picture of lukewarm foreign demand at auctions. The foreign purchase share at U.S. Treasury coupon auctions has declined to roughly 6% of gross Treasury issuance, roughly half of the average purchases seen in 2021 and the first half of 2022. Despite the decline in demand at Treasury note and bond auctions, auction demand for bills has improved, reaching the highest relative share in 10 years at roughly 12.5%.

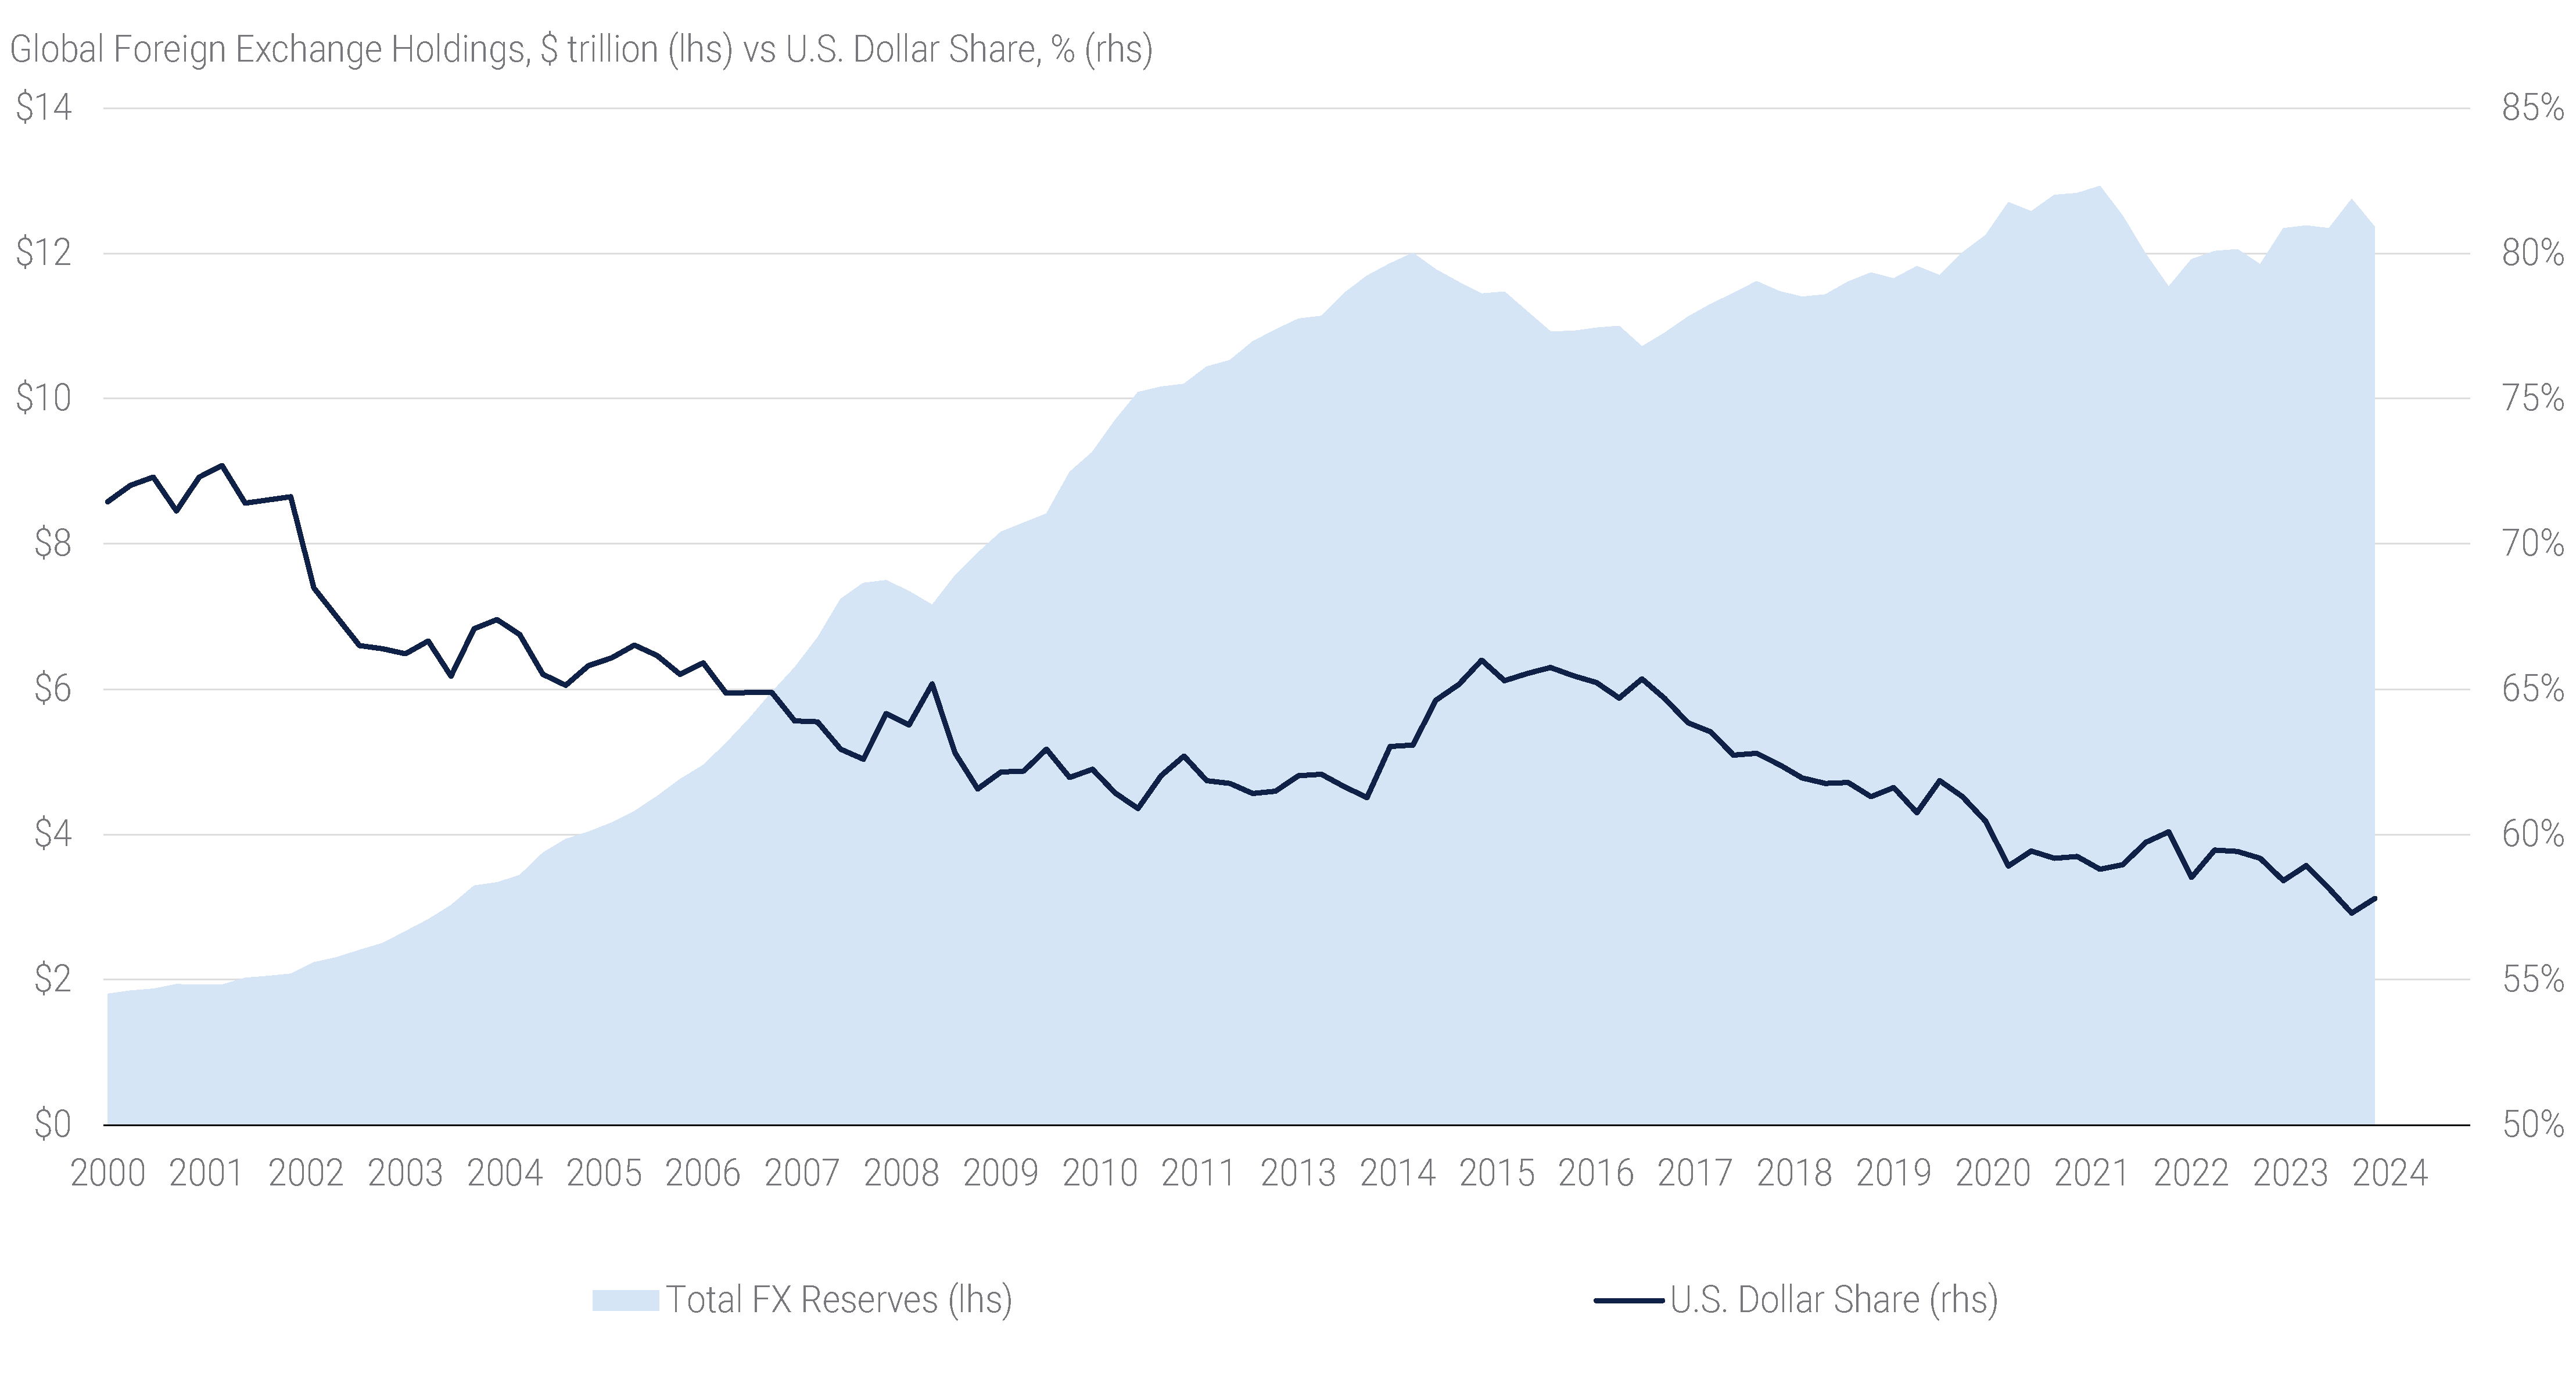
A related dimension in the foreign demand picture has been the currency allocation decisions of reserve managers. Foreign exchange reserves have stood at around $12 trillion for several years now according to the International Monetary Fund, with roughly three-fifths of these exchange reserves being held in U.S. Dollars (see panel 4).

Panel 4:

The U.S. Dollar Share of Global FX Reserves Has Declined Gradually

A modest reallocation away from the U.S. Dollar could result in sizeable flows. For example, if reserve managers were to reallocate 2% of their holdings away from the U.S. Dollar, it would result in roughly $250 billion less demand for U.S. securities, an amount that if invested in U.S. Treasuries could fund more than 10% of the current budget deficit. Ultimately, diversification away from the U.S. Dollar will be determined by global trade flows and whether other jurisdictions can offer assets attractive to reserve managers, which has been one of the largest impediments to past diversification efforts.

Overall, a shift in foreign demand for U.S. fixed income and equity securities will likely be a slow-moving development if it comes to fruition. For now, it appears that fears over sizeable short-term sales from overseas accounts to the U.S. Dollar holdings are overblown. A good part of the explanation is that sudden shifts would force foreign investors to realize losses on their portfolios and that there are simply few attractive alternatives in which to allocate holdings. However, similar to the reserve manager reallocation, a slow-moving shift out of the U.S. Dollar could still be impactful over time. Treasury and Agency MBS markets have faced large supply and narrow investor bases in recent years, which have contributed to elevated spread and rate volatility. Maintaining a broad buyer base that includes international investment would therefore be beneficial, if not necessary.


Disclaimer

Endnotes